


.png?width=141&height=141&name=Transact%20(1).png)






.svg)

.svg)
.svg)
.svg)


%201.svg)
















Application Performance Monitoring: A Practical Guide
Quick answer
Application performance monitoring (APM) tracks software performance — from runtime architecture to real user experience — across your entire application stack, so teams can catch and fix problems before they reach customers. Done well, APM extends past a single app to a multi-vendor, full-stack view of everything that app depends on.
Key takeaways
- What APM actually measures, and where its scope stops and starts.
- How APM relates to observability — connected disciplines, not the same thing.
- The five components every practical APM approach has to cover.
- The technical, business, and team-level benefits of moving beyond siloed tools.
- What to check before committing to an APM platform.
- The most common reasons APM rollouts stall, and how to avoid them.
What is application performance monitoring?
One question, five moving parts.
Application performance monitoring (APM) tracks software performance metrics across your entire application stack — not just the application itself.
Using monitoring software and telemetry data, APM's core job is to keep systems available, keep response times fast, and keep the experience consistent for the people using them.
APM applies to mobile apps, websites, and business applications. But in a highly connected, geographically dispersed environment, that scope expands to the services, processes, hosts, logs, networks, and end users — both customers and employees — that touch those applications.
Done properly, APM gives organizations the analytics and reporting to understand performance trends and user behavior patterns, and to catch complex performance problems before they escalate.
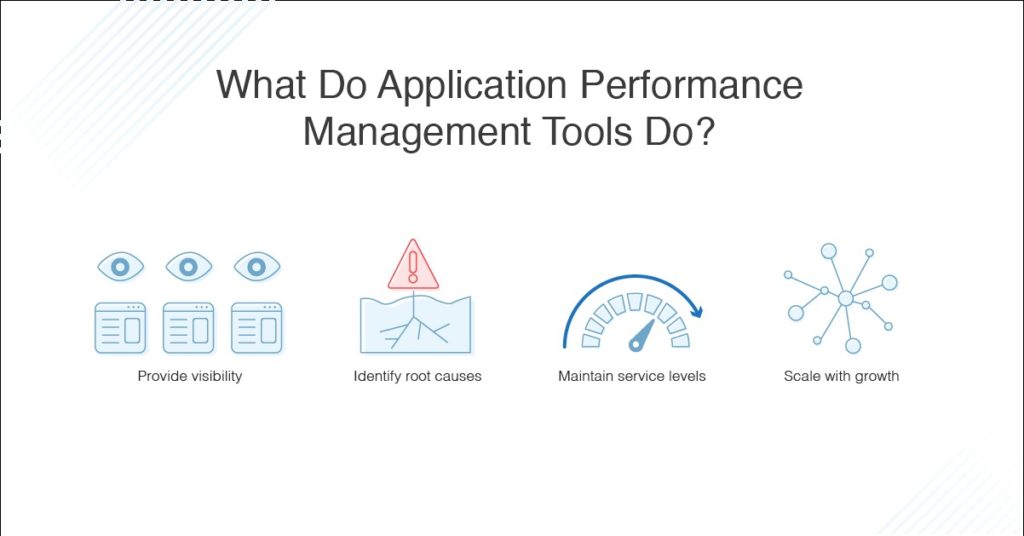
Image source: DNS Stuff
New to the concept? Start with the basics.
How APM connects to observability
Related disciplines, different jobs.
APM and observability solve different problems, and conflating them costs teams time.
APM focuses on monitoring and optimizing the performance of a defined application. Observability provides the broader, more interconnected view needed to troubleshoot and adapt business-critical systems when something unfamiliar happens. Both matter for meeting Service Level Agreements (SLAs) — but APM tells you how a known application is performing, while observability tells you why an unfamiliar problem is happening in the first place.
Application performance management strengthens observability, extends system availability, and improves response times and user satisfaction — but it isn't a substitute for a full observability practice across your stack. Together, the two give teams a more resilient application environment and, ultimately, better business outcomes.
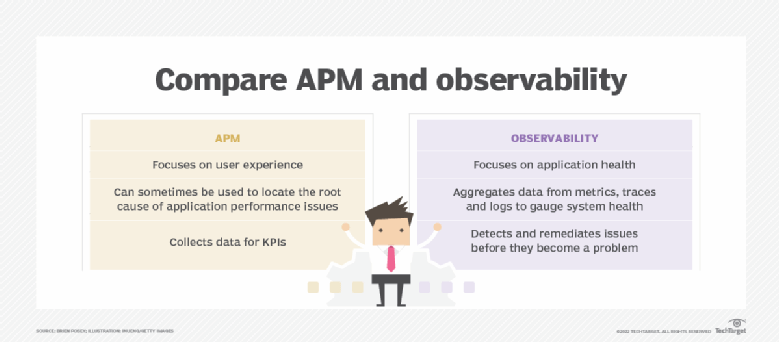
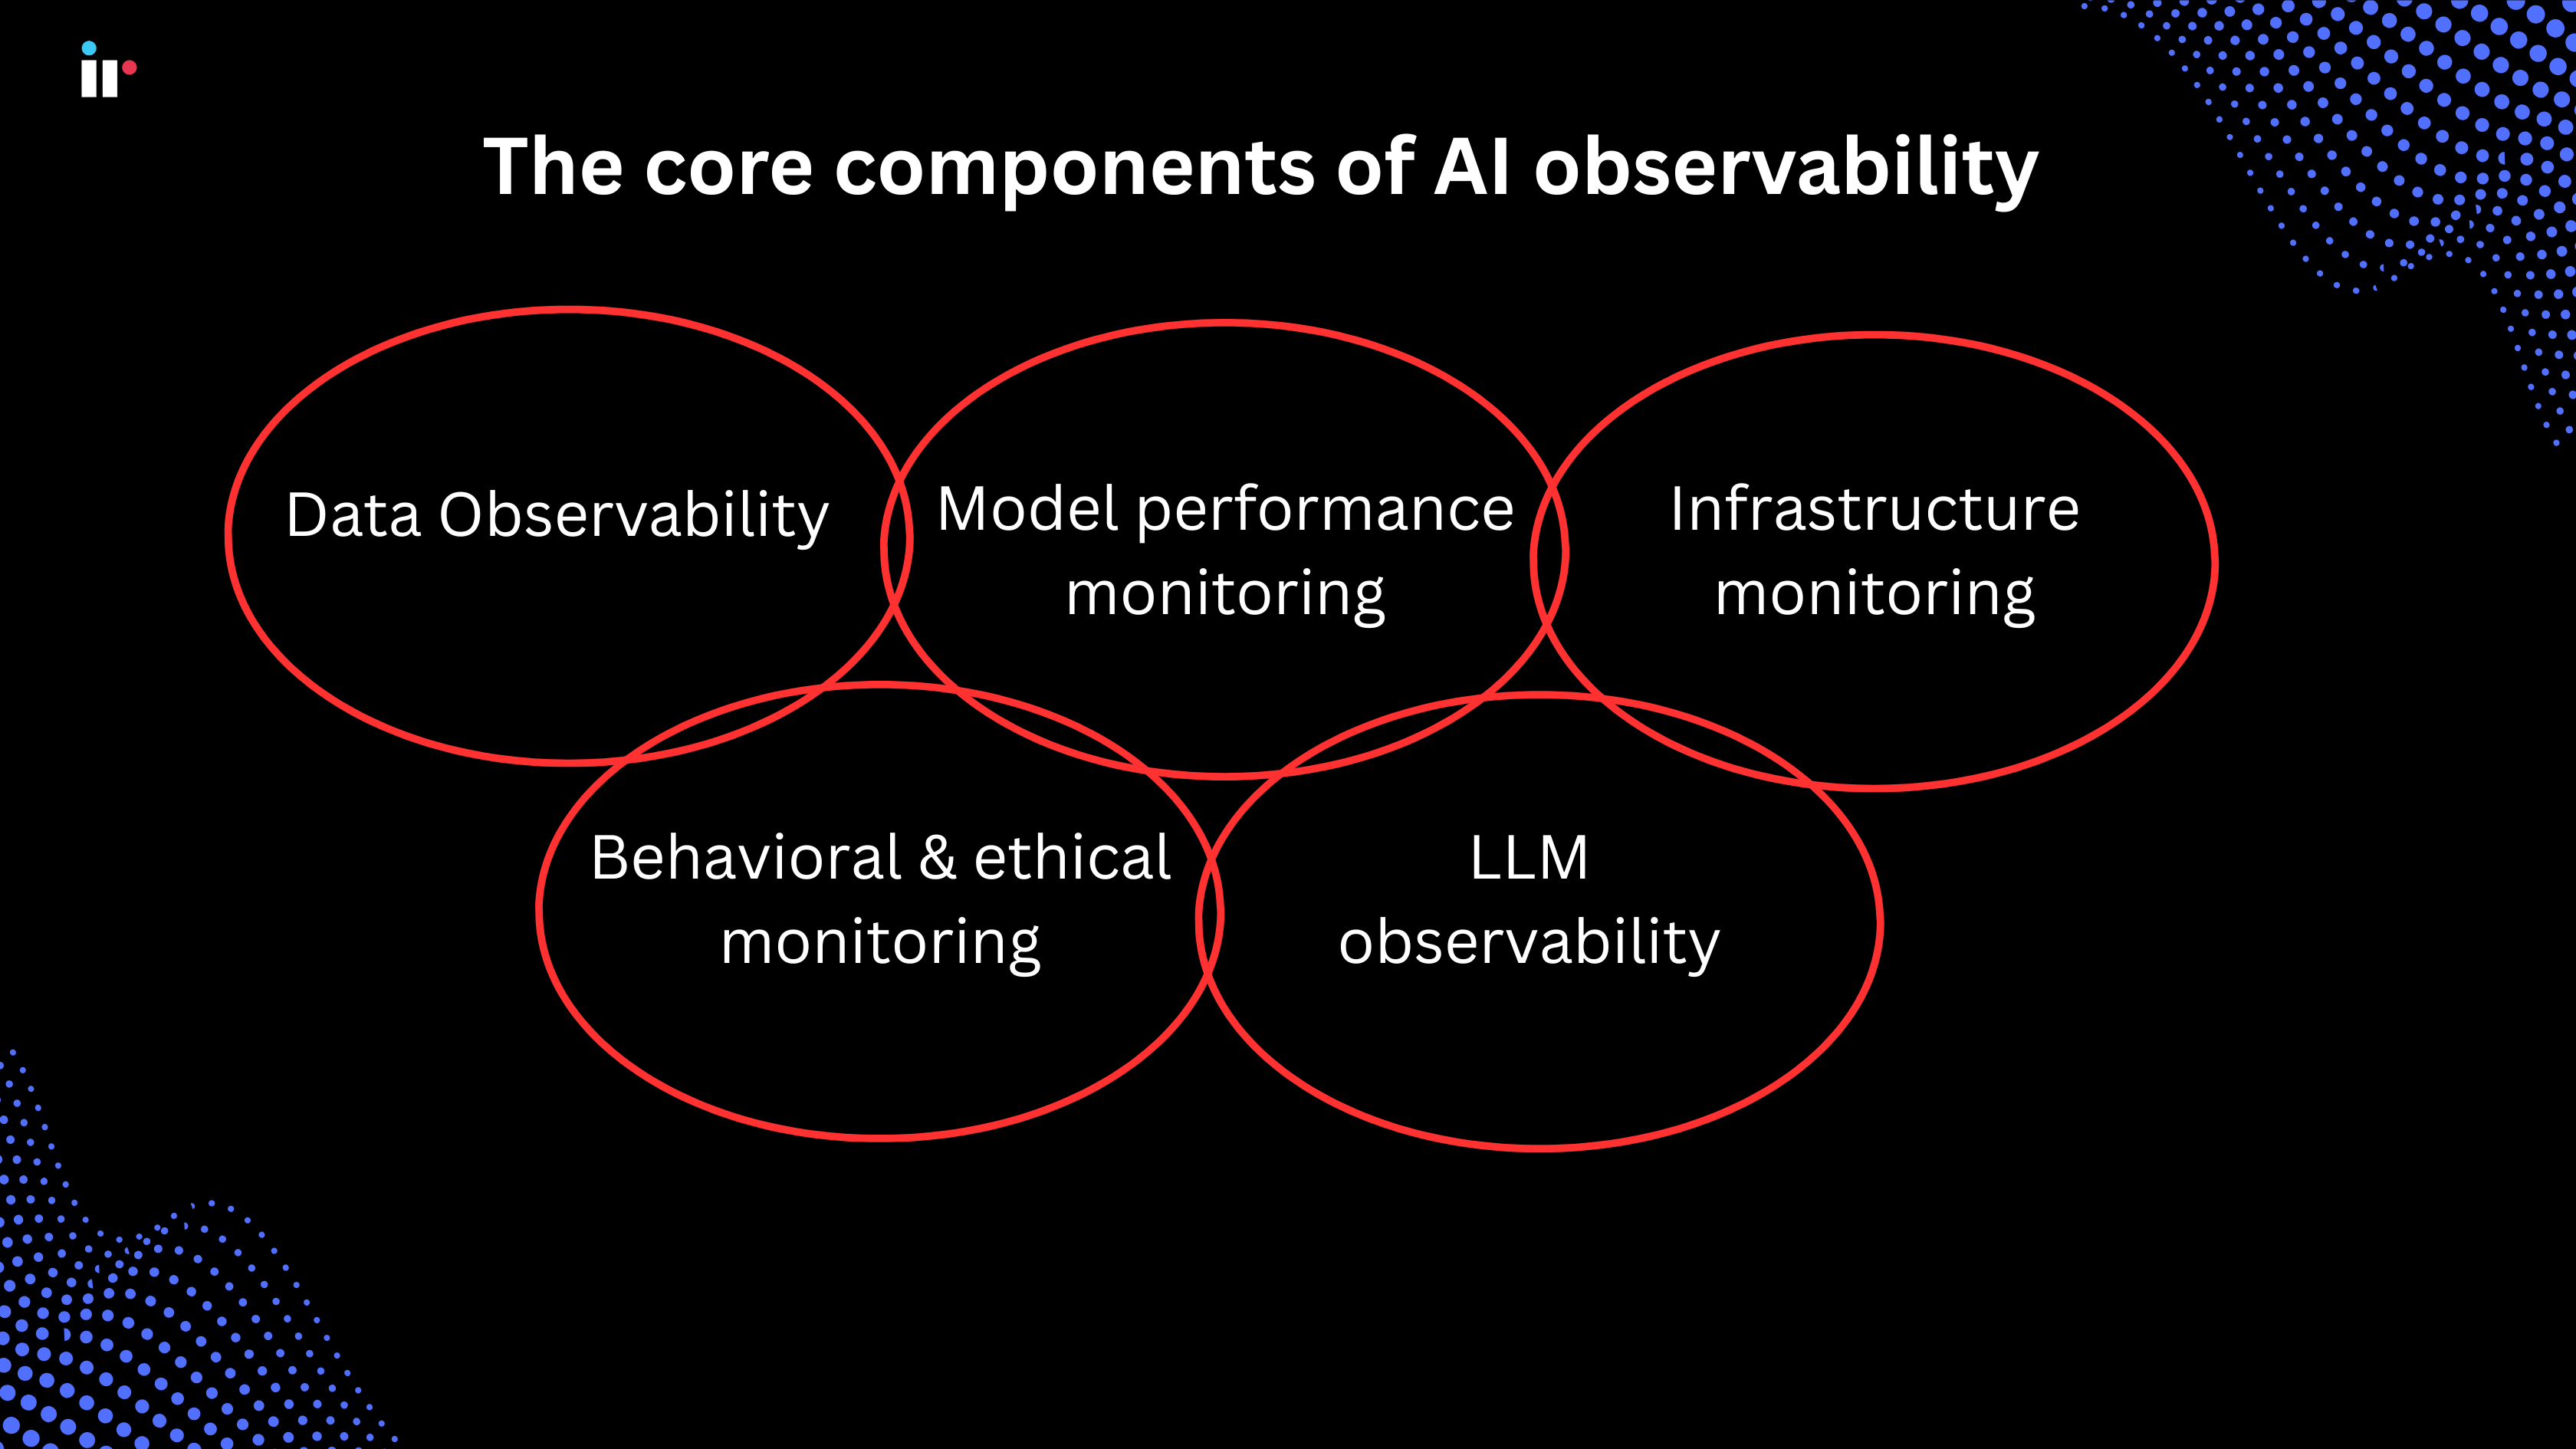
Image source: Tech Target
For more in-depth information on observability
Key components of APM
Five parts, one system.
Application performance monitoring tracks five primary components of app performance:
1. Runtime application architecture
This analyzes how an application's hardware and software components function, and the specific paths they use to communicate. Through pattern recognition and early identification of performance problems, APM solutions help IT teams anticipate future problems before they happen.
2. Real user monitoring
This is a core element of APM, often called end user experience monitoring. It collects user-based performance data that tracks and explains application availability and how well the app is performing for real users.
For example, real user monitoring can flag response times that exceed a comfortable threshold, creating alerts on lag or app response issues. There are two ways to track end user experience:
-
Synthetic monitoring.
Using probes and bots, this method simulates an end user to identify a problem before the app is actually opened by a real one. Synthetic monitoring can also track any SLAs associated with the app. -
Infrastructure monitoring.
Infrastructure monitoring provides visibility into the health of the back-end components that run your applications, ensuring critical services stay available and perform as expected.
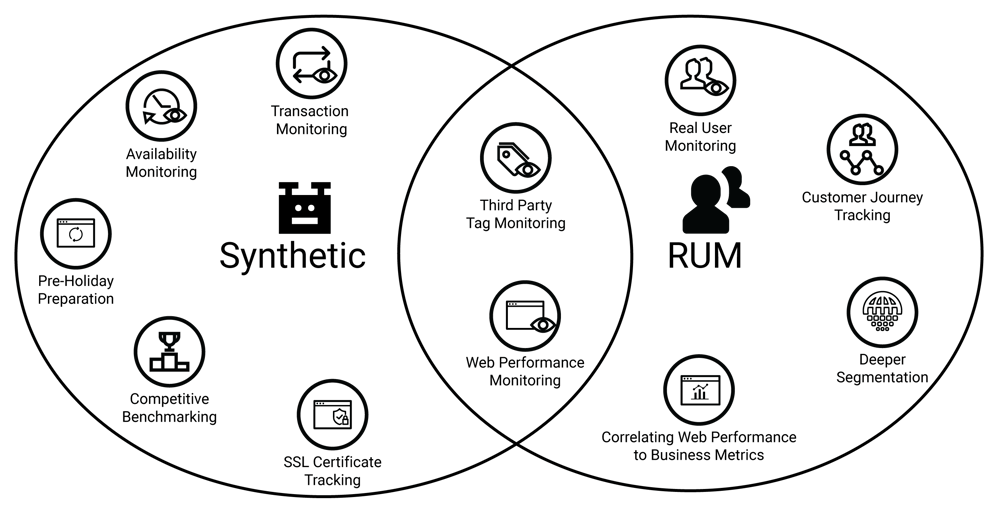
Image source: BlueTriangle
3. Business transactions
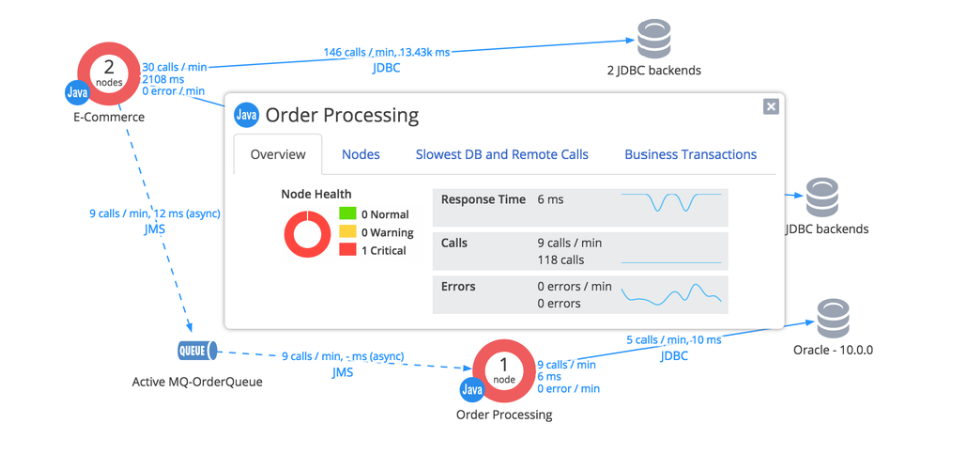
Also known as user-defined transaction profiling, this component examines specific user interactions and recreates them to understand what caused a performance problem.
This helps organizations trace events as they move across an app's components, surfacing where performance issues are occurring and whether performance efficiency is where it should be. This kind of profiling is vital for effective troubleshooting in complex app environments.
4. Component monitoring
Sometimes called an application component deep dive, this element tracks every component of the IT infrastructure — proactively monitoring resources and events across servers, operating system, middleware, application, and network components.
5. Analytics and reporting
This element takes the data gathered from the previous four processes and turns it into decisions:
-
It uses historical and current data to define a performance baseline that sets an expectation for normal application performance.
-
It identifies potential areas of improvement by comparing changes in infrastructure components to performance changes.
-
It identifies, locates, and resolves performance issues, using historical and baseline data.
-
It predicts and helps prevent future performance issues, based on actionable insights.
Analytics and reporting are what turn an APM investment into a measurable return.
Find out how
Data Observability Empowers Informed Decisions
Benefits of APM tools
Three audiences, one platform.
We've already covered why full-stack visibility matters for your software applications and their components — CPU usage, memory demands, and application behavior. Here's how that value breaks down across three groups in your organization.

Technical benefits
APM practices and tools are a significant asset for both business Ops and DevOps teams, including:
-
Increased stability and uptime: applications and operating systems stay available longer, with fewer unplanned incidents.
-
Fewer performance incidents: full-stack monitoring catches issues before they cascade.
-
Faster resolution: teams find and fix problems faster when a performance baseline isn't met.
-
Faster, higher-quality releases: performance problems surface before code ships, not after.
-
Real-time health visibility: teams can assess application health as conditions change, not only after an incident.
-
Better infrastructure utilization: teams see what's actually being used, not just what's provisioned.
Concrete business benefits
The C-suite has just as much to gain from APM as the DevOps front line. An APM framework connects application performance to business outcomes, so leaders can make informed decisions based on how performance affects the metrics they're accountable for:
-
Higher team productivity: developers and operations teams spend less time collecting data by hand and more time acting on it.
-
More time for growth: ready-to-use data frees up time for innovation instead of firefighting.
-
Stronger customer loyalty: a better user experience improves conversion rates and retention.
-
Lower operating costs: fewer manual interventions and faster resolution reduce the cost of keeping systems running.
Soft business benefits
APM gives teams a shared, reliable source of truth to work from. That shared visibility builds confidence and motivation across application, operations, and development teams — helping them align faster when problems arise and work together more effectively to solve them.
How to evaluate an APM platform
What to check before you commit.
Not every APM platform solves the same problem. Before you commit to one, check it against criteria that matter more than the feature list on the datasheet:
-
Multi-vendor coverage: can it see across every vendor and technology in your stack, or only the ones it was built for?
-
Full-stack correlation: does it connect application, infrastructure, and network telemetry in one place, or leave your team cross-referencing dashboards manually?
-
Real user and synthetic monitoring, together: does it combine both, or force you to choose one?
-
Deployment fit: does it support your actual environment — on-premises, cloud, or hybrid — without a separate tool for each?
-
Time to root cause: how quickly can a team go from an alert to the actual cause, not just the symptom?
-
Business-outcome reporting: can it translate technical performance into the cost, risk, and revenue terms your leadership team asks about?
A platform that looks strong on paper but only covers part of your environment leaves the same blind spots APM is supposed to close.
Best practices and common challenges
Where APM rollouts go wrong.
Most APM challenges aren't technical — they're about scope and ownership.
-
Start with a baseline, not a dashboard. Without a defined normal, teams can't tell a real problem from routine variance. Set performance baselines before you set alert thresholds.
-
Cover the whole stack from day one. Adding monitoring application by application recreates the same blind spots APM is meant to remove. Multi-vendor, multi-domain coverage should be the starting point, not a phase-two upgrade.
-
Give business context to technical alerts. An alert reading "response time exceeded 400 milliseconds" means little to a non-technical stakeholder. Pair every technical threshold with the business or customer impact it represents.
-
Plan for ownership, not just deployment. APM data only helps if someone is accountable for acting on it. Decide who owns triage, who owns root cause, and who owns the fix before go-live.
-
Revisit thresholds regularly. Environments change — new services, new vendors, seasonal traffic. A baseline set once and never revisited becomes noise within months.
Finding the right APM platform: IR Collaborate
One platform, not a dozen tools.
Most teams patch together individual tools for infrastructure monitoring, network monitoring, database monitoring, log, container, cloud, synthetic, and end-user monitoring. The Prognosis platform replaces that patchwork with a single, full-stack view — delivered through IR Collaborate for unified communications and contact center environments, IR Transact for payment environments, and IR Infrastructure for mission-critical HPE NonStop systems. All three run on the same telemetry model, so the way a problem gets traced from symptom to root cause stays consistent no matter which environment you're monitoring.
Enterprise UC: speed problem resolution and increase uptime
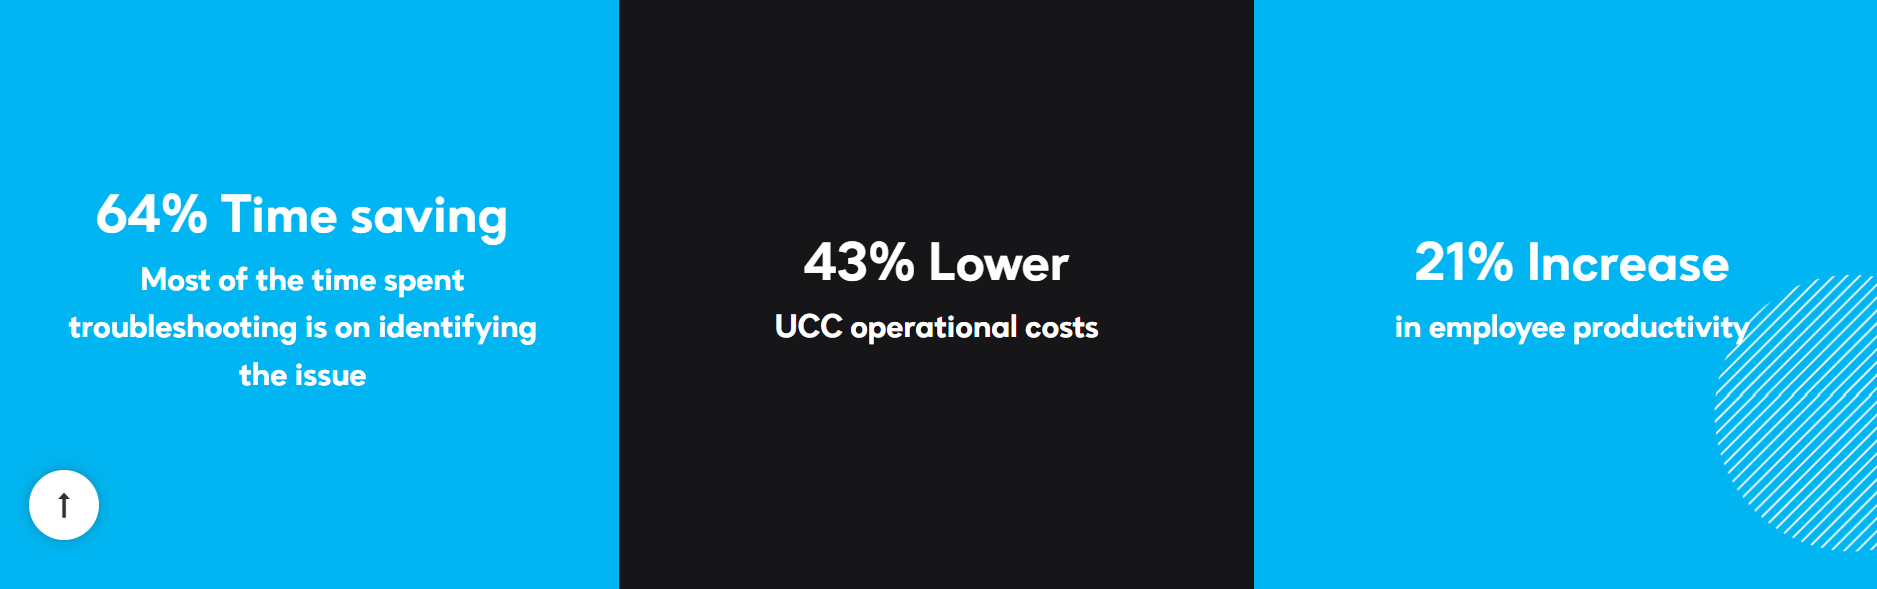
In a complex, multi-vendor unified communications ecosystem, IR Collaborate helps you avoid, and quickly find and resolve, performance issues in real time across your on-premises, cloud, or hybrid environments — with visibility through a single pane of glass.
Service providers: simplify complexity
With API-driven access to multiple client environments in a single application, IR Collaborate helps you manage the complexity of multiple tenants and technologies — giving you the insight you need, tenant by tenant, to deliver a consistent service.
Contact centers: test your voice and video
Contact centers are a vital channel for customers to interact with your brand. Keep your voice quality, connection, availability, and critical systems problem-free, so you can deliver a consistently strong customer experience.
Experience testing: delivering a stronger customer experience
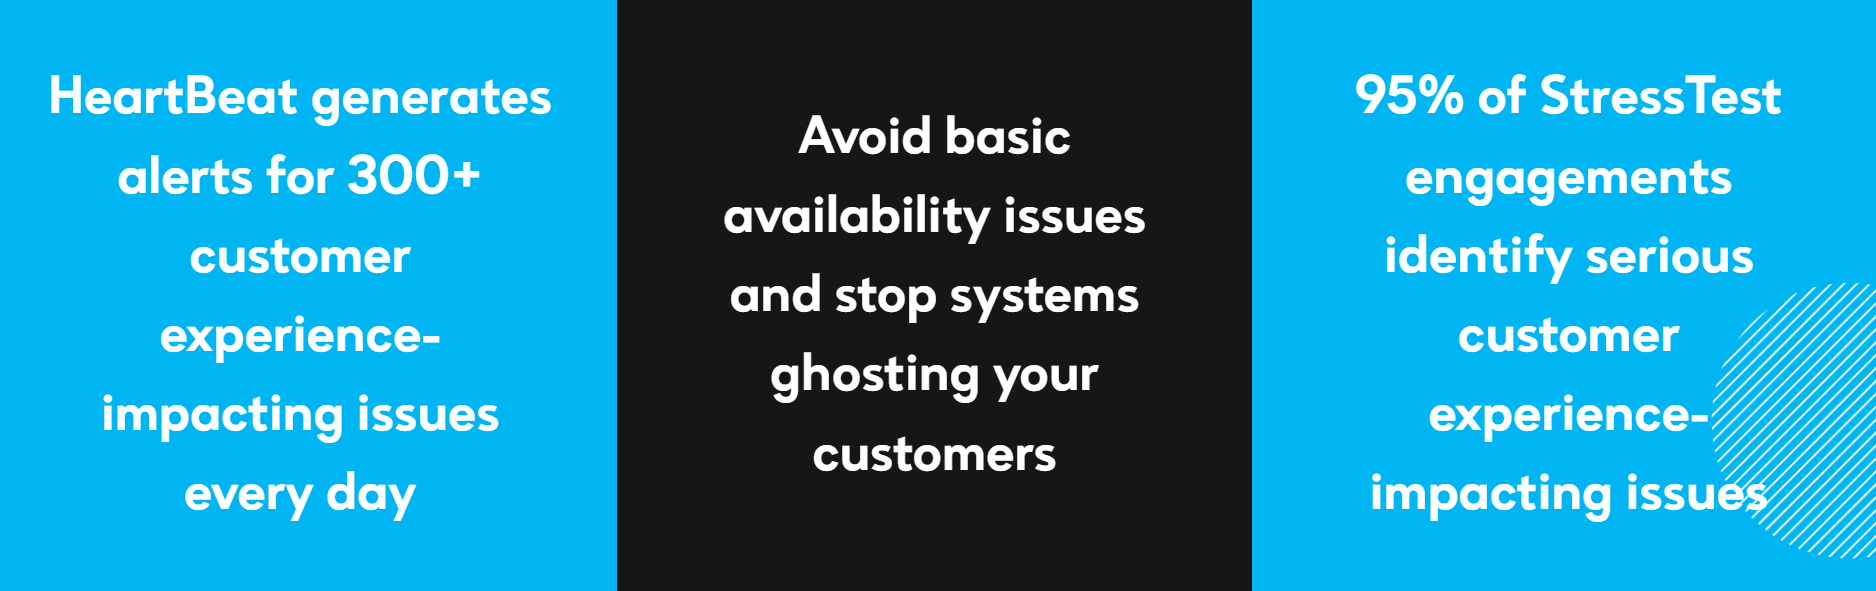
IR Collaborate's voice, web, and video testing solutions expose the gap between your assumptions and actual system performance, and provide the real-time insights you need to close it.
Collaboration space management
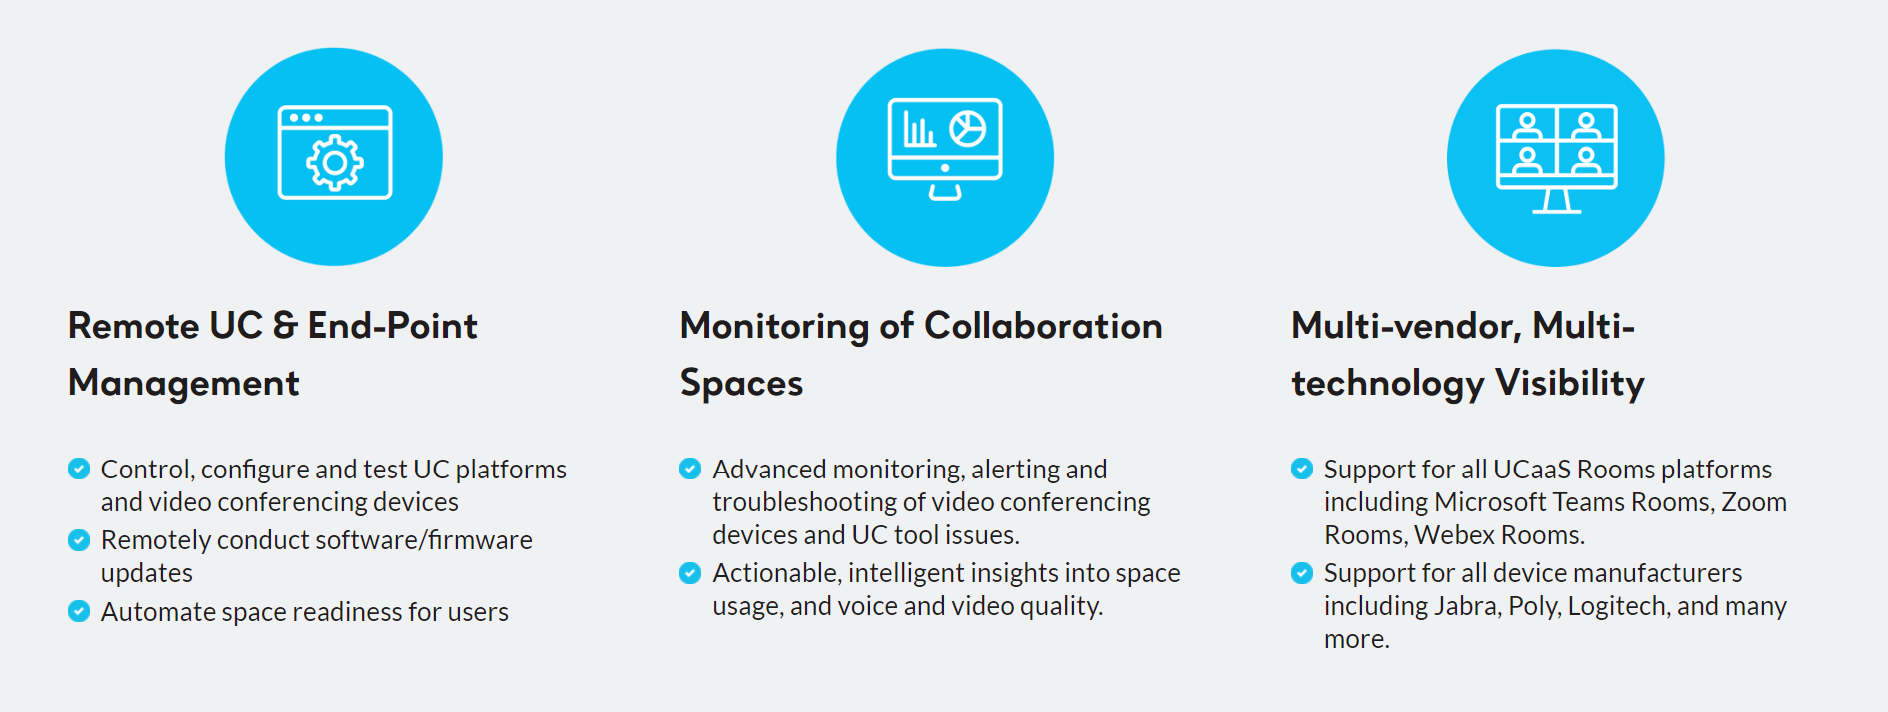
Collaboration space management enables proactive monitoring and remote management of every conferencing-enabled collaboration space from a single point of view.
Frequently asked questions
Quick answers, ready to expand.
Conclusion
The real question isn't whether to monitor application performance — it's whether your team can see the whole picture, or just the part one tool happens to cover. Multi-vendor, full-stack visibility is what turns performance data into a business advantage, not just another dashboard to check.
Find out how you can implement APM