
.png?width=141&height=141&name=Transact%20(1).png)


Observability in IT and cloud computing, is the ability for IT teams to measure, monitor and analyze internal system performance and system health, based on that system's external outputs.
When organizations back up facts with high quality system data to make decisions, they automatically gain the power and control they need to maximize business impact.
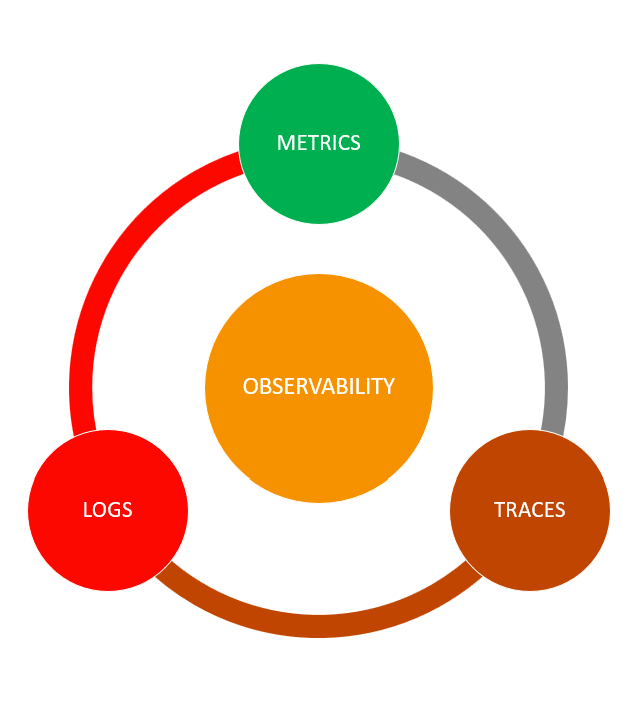
The three core elements of data observability are metrics, logs and traces. These elements become more effective and overall data quality improves by further breaking them down into their own related 5 pillars of observability, which we've covered in comprehensive detail in our guide.
Want to know more? Read our guide.
How Data Observability Empowers Informed Decisions
The utilization of cloud services and third-party API is growing exponentially. This means a massive increase in the amount of data created across an organization's technology stack, from the application and infrastructure to the network and security.
While traditional monitoring tools and applications focus on individual areas of software systems, the concept of observability centers around a deeper and more unified view of complex distributed systems by collecting and analyzing data from all parts of the system. But what is observability in the context of digital transformation as a whole?
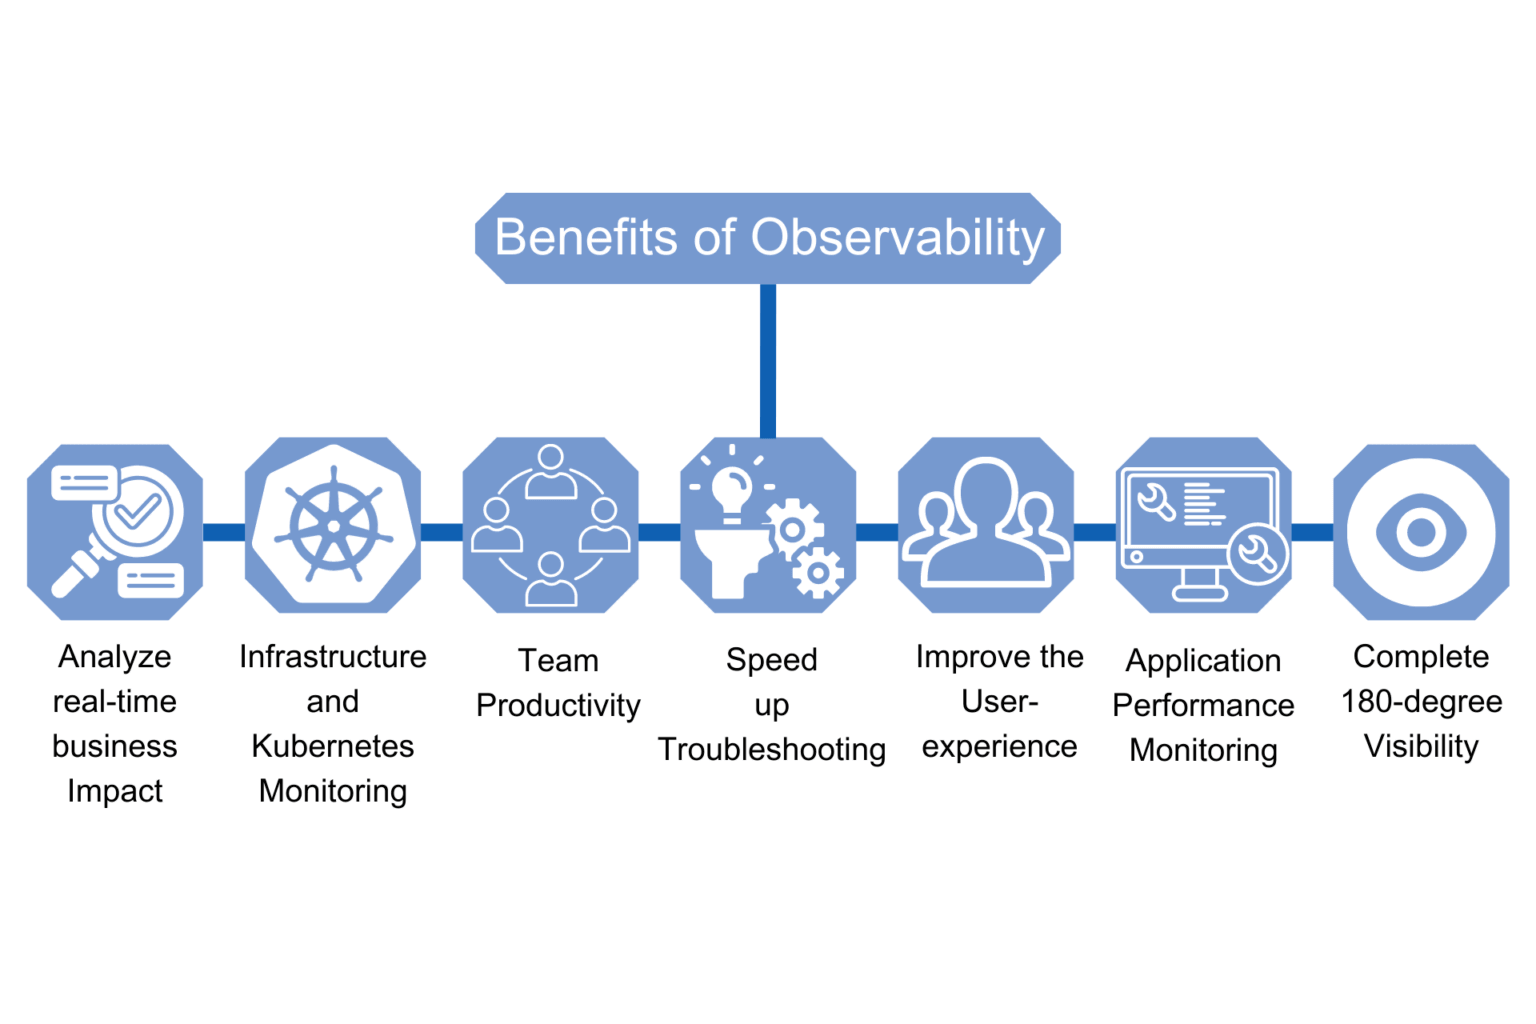
Image source: CloudZenix
In this guide, we'll cover the reasons why enterprise organizations need to implement observability tools to drive the actionable insights necessary in modern distributed systems, and suggest some best practices.
We'll examine in detail how full data stack observability creates business value by correlating application performance metrics, performance data aggregation and ultimately, the key performance indicators (KPIs) for your business.
Telemetry data and the components of observability
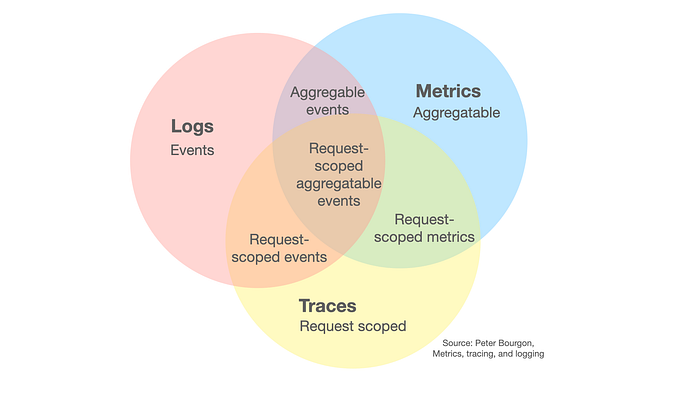
In complex systems, logs, metrics and traces are the three data inputs, which together provide DevOps, data analysts, data managers and software engineers with a holistic view into distributed systems and application performance.
Today there is greater emphasis on a system's health, performance and uptime, because they relate directly to user experience.
Want to know the key to improving customer experience?
Sometimes referred to as 'The Golden Triangle of Observability', these three pillars strengthen the foundation of the observability architecture that enables IT personnel to identify and diagnose the internal states of a system and its problems, regardless of where the servers are.
The telemetry data collected through logs, metrics and traces creates a unified observability platform enabling IT teams to carry out application performance monitoring
Metrics
In an observable system, metrics paint the overall picture of a distributed IT infrastructure.
Metrics numerically represent data that can be used to measure the behavior of system elements over a specified period of time. Metrics comprise a set of attributes, including name, label, timestamp and value, that reveal information about SLAs, SLIs and SLOs.
Data engineers or IT managers within your organization decide which metrics to collect. Popular metrics are CPU utilization, latency, network traffic, or user signups.
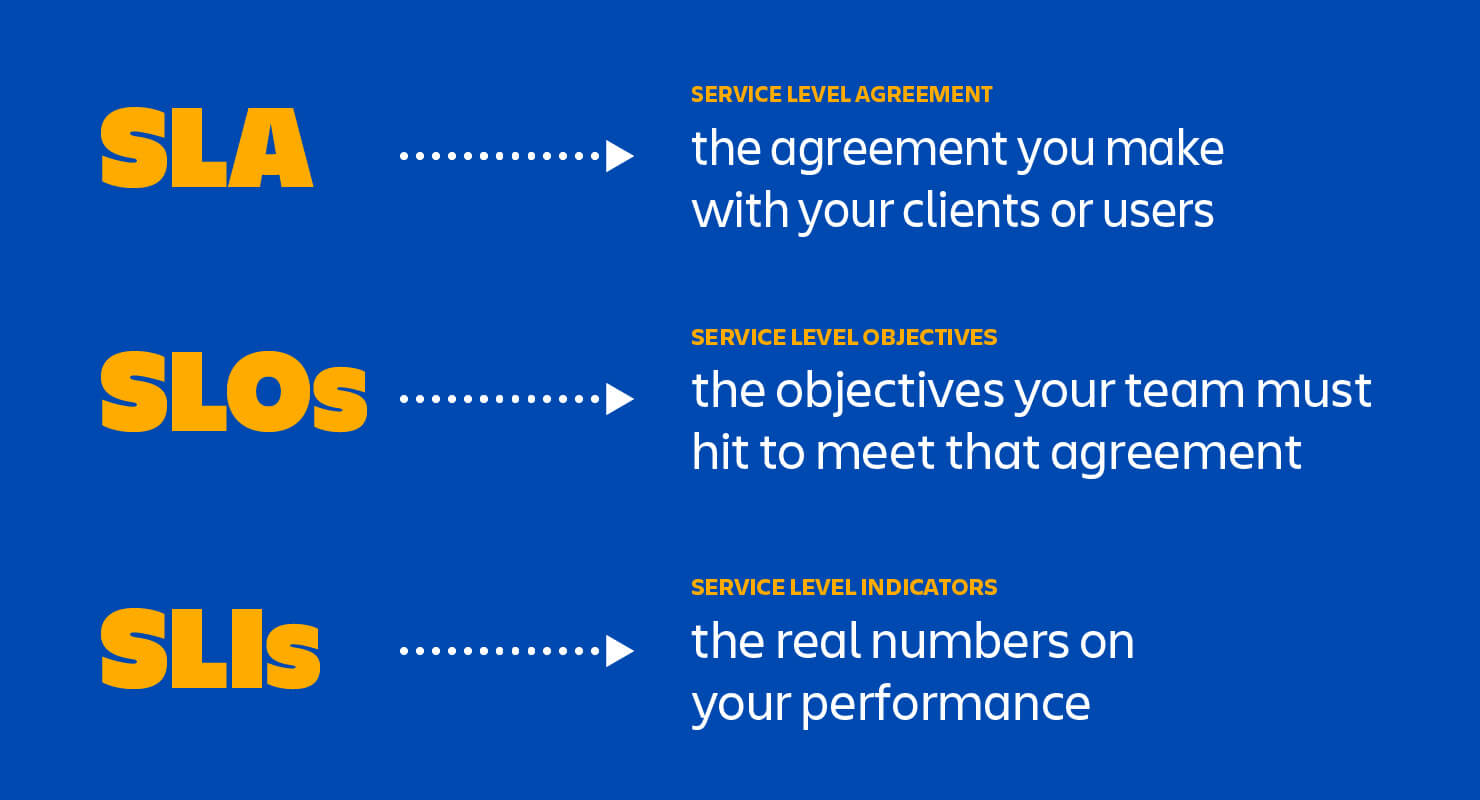
Image source: Atlassian
As a measured value derived from overall system performance, metrics can be a time-saving boon to data managers and Ops engineers. For example:
-
Metrics can be correlated across different infrastructure components to reveal a holistic view of a system's health and performance.
-
Metrics are useful to provide meaningful insights on a system's uptime, response time, the number of requests per second, how much processing power or CPU an application is using.
-
Metrics are also used to trigger alerts when a system value deviates from a specified threshold.
-
They monitor baseline performance, identify the source of any anomalies and when they occur and identify trends. Metrics aren’t one size fits all.
Metrics, however, focus on one area of the system making it hard to track issues across distributed systems.
Best practices suggest that data collection should be carried out in regular intervals and use numerical values to store metrics.
Read our guide.
Enhancing the Customer Experience With Digital Experience Management (DEM)
Logs
Logs are best described as records, or structured and unstructured lines of text that a system produces in response to certain codes.
Generally speaking, logs are a record of an event that happened within an application:
-
Logs help uncover unpredictable and emergent behaviors, warnings and errors picked up within the components of microservices architecture.
-
Most application frameworks provide support for logging, which generates records of actions and events across a distributed system.
-
The historical records created by logs provides insight into issues with software tools, and within the software environment as a whole. When an error occurs, the logs show when it occurred and which events it relates to.
While logs are one of the important elements of observability, there's a subtle balance between them being helpful or harmful. For example, too much data could overload a system and lead to higher latency.
Additionally, logs take up a lot of space, and have a limited lifespan of usefulness.
Best practices suggest storing logs long enough to get what's needed from them, then remove or archive accordingly.
Traces
While logs and metrics help you understand individual system behavior and performance, full observability within a complex digital system won't work without tracing.
Traces are used to follow the end-to-end behavior of a request as it progresses through all the components of a microservice or distributed system:
-
Traces allow the profiling and observation of each system component, enabling root cause analysis and easier discovery of bottlenecks and interconnection issues.
-
Trace data elevates visibility into requests that use multiple internal microservices.
-
Traces provide insights into the behavior of a request at specific points in an application, such as proxies, caches and middleware, to identify anomalies or deviations in the execution flow. or network hops across system boundaries.
Traces are the only way to gain end-to-end visibility into service interactions and to identify the root cause of performance problems.
Why is observability important?
As we've discussed the three core elements that allow you to achieve observability, we've discovered that an observable system relies on telemetry data derived from cloud environments.
We know that every hardware, software, and cloud infrastructure component and every container, open source tool, and microservice is raw data, which generates records of every activity. An observability solution allows deep visibility into a complex system. Being able to observe the business context of each application, data teams can prioritize which issues have the largest impact on business objectives.
The goal of a full system observability platform is to understand what’s happening across all these environments and among the technologies, so you can detect and resolve issues to keep your systems efficient and reliable and your customers satisfied.
Gartner estimates that poor data quality costs companies nearly $13 million per year, while Harvard Business Review finds that data professionals spend about half of their time fixing their organization's data issues.
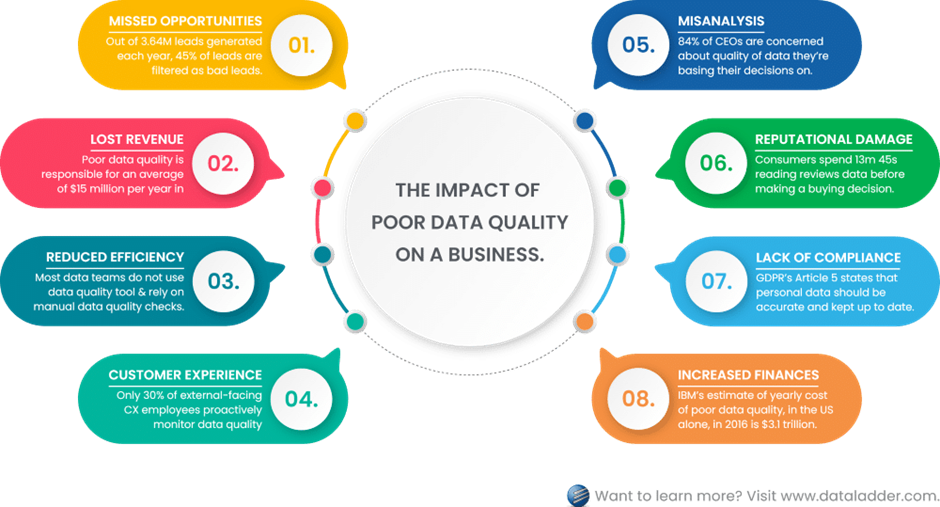
Image source: DataLadder
Observability in the software development process
An observability solution is critical in software application development, as it enables operations and software engineering teams to intercept and resolve issues early in development.
What makes observability important in the software development process is that it makes the whole software delivery process faster and more streamlined than ever and allows for agile development, enabling DevOps teams to easily identify and fix issues in new code before errors occur.
Observability vs Monitoring
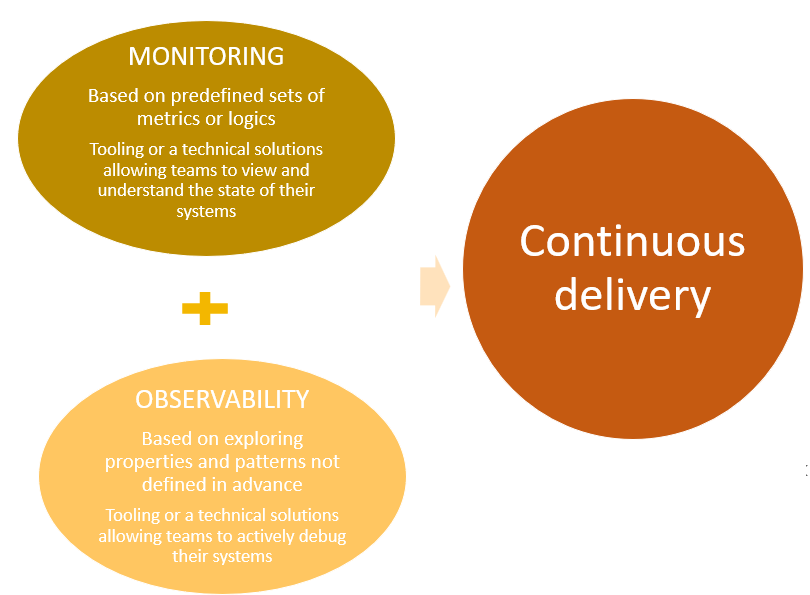
Observability and monitoring is a set of capabilities that drives higher, more continuous software delivery and organizational performance.
The DORA State of DevOps research program discovered of these capabilities in an independent and academically painstaking analysis of what drives high performance.
Good monitoring is a predominant feature of high-performing teams. DORA shows that a comprehensive monitoring of telemetry data, and observability tools, combined with other technical practices, positively contributes to continuous delivery.
What constitutes good monitoring and observability?
Good monitoring and observability requires operations teams to have the following in place:
-
Reporting on the overall operational condition of systems and internal states.
-
Are systems functioning as expected? Do they have enough resources available for incident response?
-
-
Reporting on end user experience of system state.
-
Are customers having a bad experience? Do they know if the system is down?
-
-
Monitoring for critical business and systems metrics.
-
Technical observability solutions to help understand and debug systems in production.
-
Tooling to identify unknown unknowns - ie things not previously known about a system's health.
-
Access to observability tools and incident data that help track, and provide insights into infrastructure problems, including interactions between services, downtime and other problems related to cloud environments.
How to implement good monitoring and observability
Monitoring and observability solutions are intended to do the following:
-
Provide accurate indications and notifications of an outage or service degradation.
-
Quickly detect outages and initiate incident response to service degradations, bugs, and application security threats.
-
Help debug outages, service degradations, bugs, and unauthorized activity.
-
Identify long-term trends for capacity planning and business purposes.
-
Reveal any side effects of system changes or added functionality.
Here is the defining criteria to what is observability and monitoring. As a set of application performance disciplines, they complement one another and are mutually inclusive.
-
Monitoring reveals what is broken and should be effective enough to help you understand why, before too much damage is done. Observability addresses the ability to quickly determine the root cause of issues you may not have been able to anticipate, by analyzing the the telemetry data.
-
Together, observability and monitoring address the key metric in outage or service failure - time-to-restore (TTR). A key contributor to TTR is having the observability tool already in place to help you quickly understand what broke and the quickest solution to restoring service.
Blackbox and Whitebox monitoring
While black-box monitoring deals more with externally visible resources such as disk space, CPU usage, and other physical variables, white box monitoring focuses more on applications running on the servers and other internals such as logs, metrics and traces.
-
White box monitoring covers your application's essential services and all traffic in general. Analyzing these numbers can produce valuable data. Using white-box methods, you can carefully monitor a web application, and many parameters, including the number of active users, number of requests to access user profiles, requests to post a comment.
-
Black-box monitoring is necessary so that you can see the resource availability of a network. If some of the servers are under attack and there is no black-box monitoring in place, the attack may spread to other servers as well, causing a potential breakdown of the entire network.

Image source: Faun
Why logs, metrics and traces aren't enough
Metrics, logs, and traces are all part of a unified observability solution. But these three pillars of observability are not enough on their own.
Profiling is an up-to-the-minute, advanced approach to collecting application performance data. Profiling techniques and tools can highlight the areas consuming most of your resources, such as CPU and memory.
Continuous profiling makes that data available to developers for deeper analysis, as it allows them to gain visibility into the unknown-unknowns of a system. Profiling answers the question of 'why', and addresses any of the visibility gaps left by the other three pillars of observability.
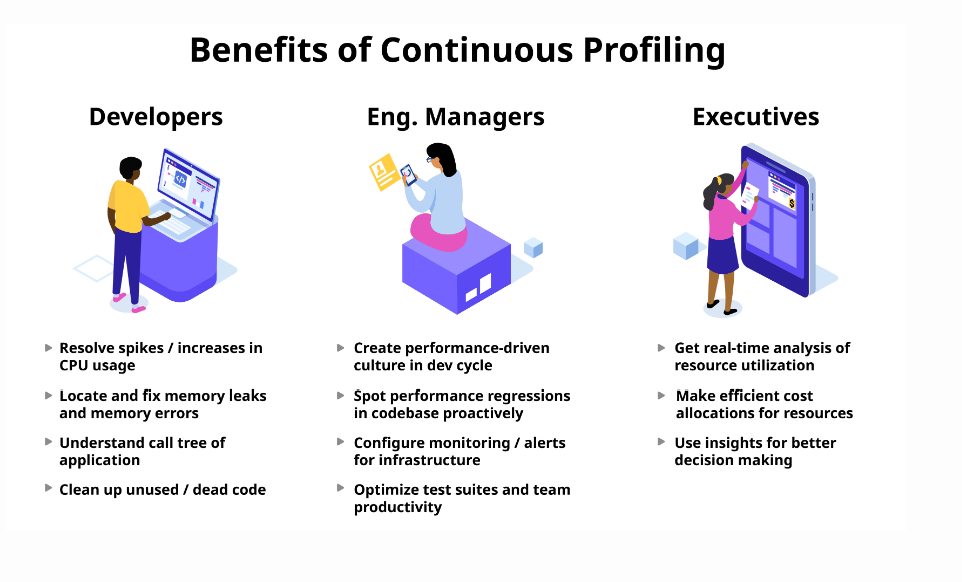
Image source: Cloud native
What are the benefits of observability for developers?
The role of DevOps is to link formerly siloed data teams and helps them work together to the benefit of both the organization and its customers.
DevOps relies on a constant flow of robust data observability to continuously monitor the state of their systems and data. Data observability provides the real time data monitoring and data analysis that is required by DevOps. DevOps teams use the key drivers of data observability to gain actionable insights into data movement, reliability, and quality.
Observability empowers data teams with the information they need to predict future behaviors and make better-informed strategic designs.
The importance of control theory in observability
Control theory refers to the process of maintaining stability and predictability in a system.
When applied to cloud systems, control in observability provides the monitoring tools to ensures that everything runs smoothly and efficiently. A good analogy would be to imagine driving a car without a speedometer to know how fast you were going, or a gas gauge to know how much fuel you had left.
Control in observability helps with cloud systems management by providing access to telemetry data giving valuable insights, such as service-level objectives met or exceeded.
Making observability actionable and scalable for IT teams
Observability should allow not just data engineers, but all IT teams to act upon the huge volumes of data collected in real-time. Some ways to make observability actionable and scalable include:
-
Understanding the context and the topology of the data stack: In today's dynamic, multicloud environments there are potentially billions of interconnected and interdependent components. Access to rich context metadata and real time topology maps provides a deeper understanding all these dependencies both vertically and horizontally throughout the data stack.
-
Implementing continuous automation: The less manual configuration work that IT has to carry out, the better equipped they are to move on with value-added innovation projects. Baselining, automatic discovery and instrumentation of system components on a continuous basis means that observability becomes scalable and 'always-on', allowing IT teams can do more with less.
-
Making everything observable: You could waste a lot of time and resources trying to build your own tools or test out multiple tools or vendors that may not provide what you need to see the whole internal state of your system. Instead, a solution that makes all your systems and applications observable, gives you valuable insights and answers, providing oinstant business value.
Choosing observability tools and dashboards
There are no one-size-fits-all observability tools. But when choosing the right tools, enterprise organizations needs to seriously consider what features they need for success.
Lets take a look at some of these features:
Alerting. Configuring the right alerts is the cornerstone of any proactive DevOps team. Your tool should ensure that you’re notified of critical events, and include a search facility that continuously scans your telemetry data to alert when certain conditions are met.
Distributed tracing. Applications built using a microservices architecture can benefit from the profiling and monitoring capabilities of distributed tracing to help pinpoint where failures occur and what causes inferior performance. Distributed tracing is a more advanced way to help keep track of what is happening in your IT environment by pinpointing the sources for request latency, and finding the service at fault when experiencing an error.
Pre-built dashboards. The ability to quickly interpret signals and information within massive amounts of telemetry data is essential in observability. Creating your own dashboards can take a lot of manual work, and often the insights they provide end up in separate silos that restrict visibility and analysis across different datasets. Having the option of pre-built dashboards that can be customized can be far more time efficient and cost-effective.
Data optimization. Observability costs can easily become out of control, and organizations can end up paying for large volumes of useless data that’s still stored in their observability systems. Observability tools should include machine learning models that can provide data optimization by automating data processing, storage and curation. This results in only paying for the data necessary to meet your particular observability requirements.
Data correlation. Troubleshooting microservices requires engineers to correlate volumes of different information from many various components to isolate issues within complex applications.This could require constantly switching across various interfaces and contexts. Data correlation shortens incident investigation and helps engineers overcome analysis challenges. This reduces Mean Time to Resolution (MTTR). A single pane of glass where all your relevant telemetry data is correlated automatically can save time and resources, and resolve challenges faster.
Image source: Enterprise IT World
Find out how to keep your IT systems working at optimum capacity.
Why choose IR monitoring tools as part of your data monitoring system?
Monitoring, together with data observability are a set of capabilities that drive better data quality, increased software performance, optimal user experience and organizational output.
Finding and solving a problem within your IT infrastructure, and resolving it quickly is essential for business operations. But the key to quickly and efficiently locating issues is having comprehensive monitoring tools on hand to identify problems in real time.
More than 1,000 organizations in over 60+ countries - including some of the world’s largest banks, airlines and telecommunications companies rely on IR Collaborate to provide business critical monitoring and insights and ensure optimal performance and user experience for their customers across the globe 24x7.
Monitor, troubleshoot, analyze and optimize critical systems with IR


