
.png?width=141&height=141&name=Transact%20(1).png)


Enterprise organizations today are relying more and more on data, or more importantly, data observability to drive their digital products, enable better decision making, and power AI and Machine Learning use cases.
When organizations use facts, backed up by high quality data to make decisions, they automatically gain the power and control they need to maximize business impact.
But at the same time, it's business-critical that the data quality is the best it can be all the way along the data pipeline.
In this comprehensive article we'll explore in detail the changing landscape of data management, and show how data observability plays a vital role in detecting, preventing and resolving data issues.
"Data is the new oil", Clive Humby, OBE
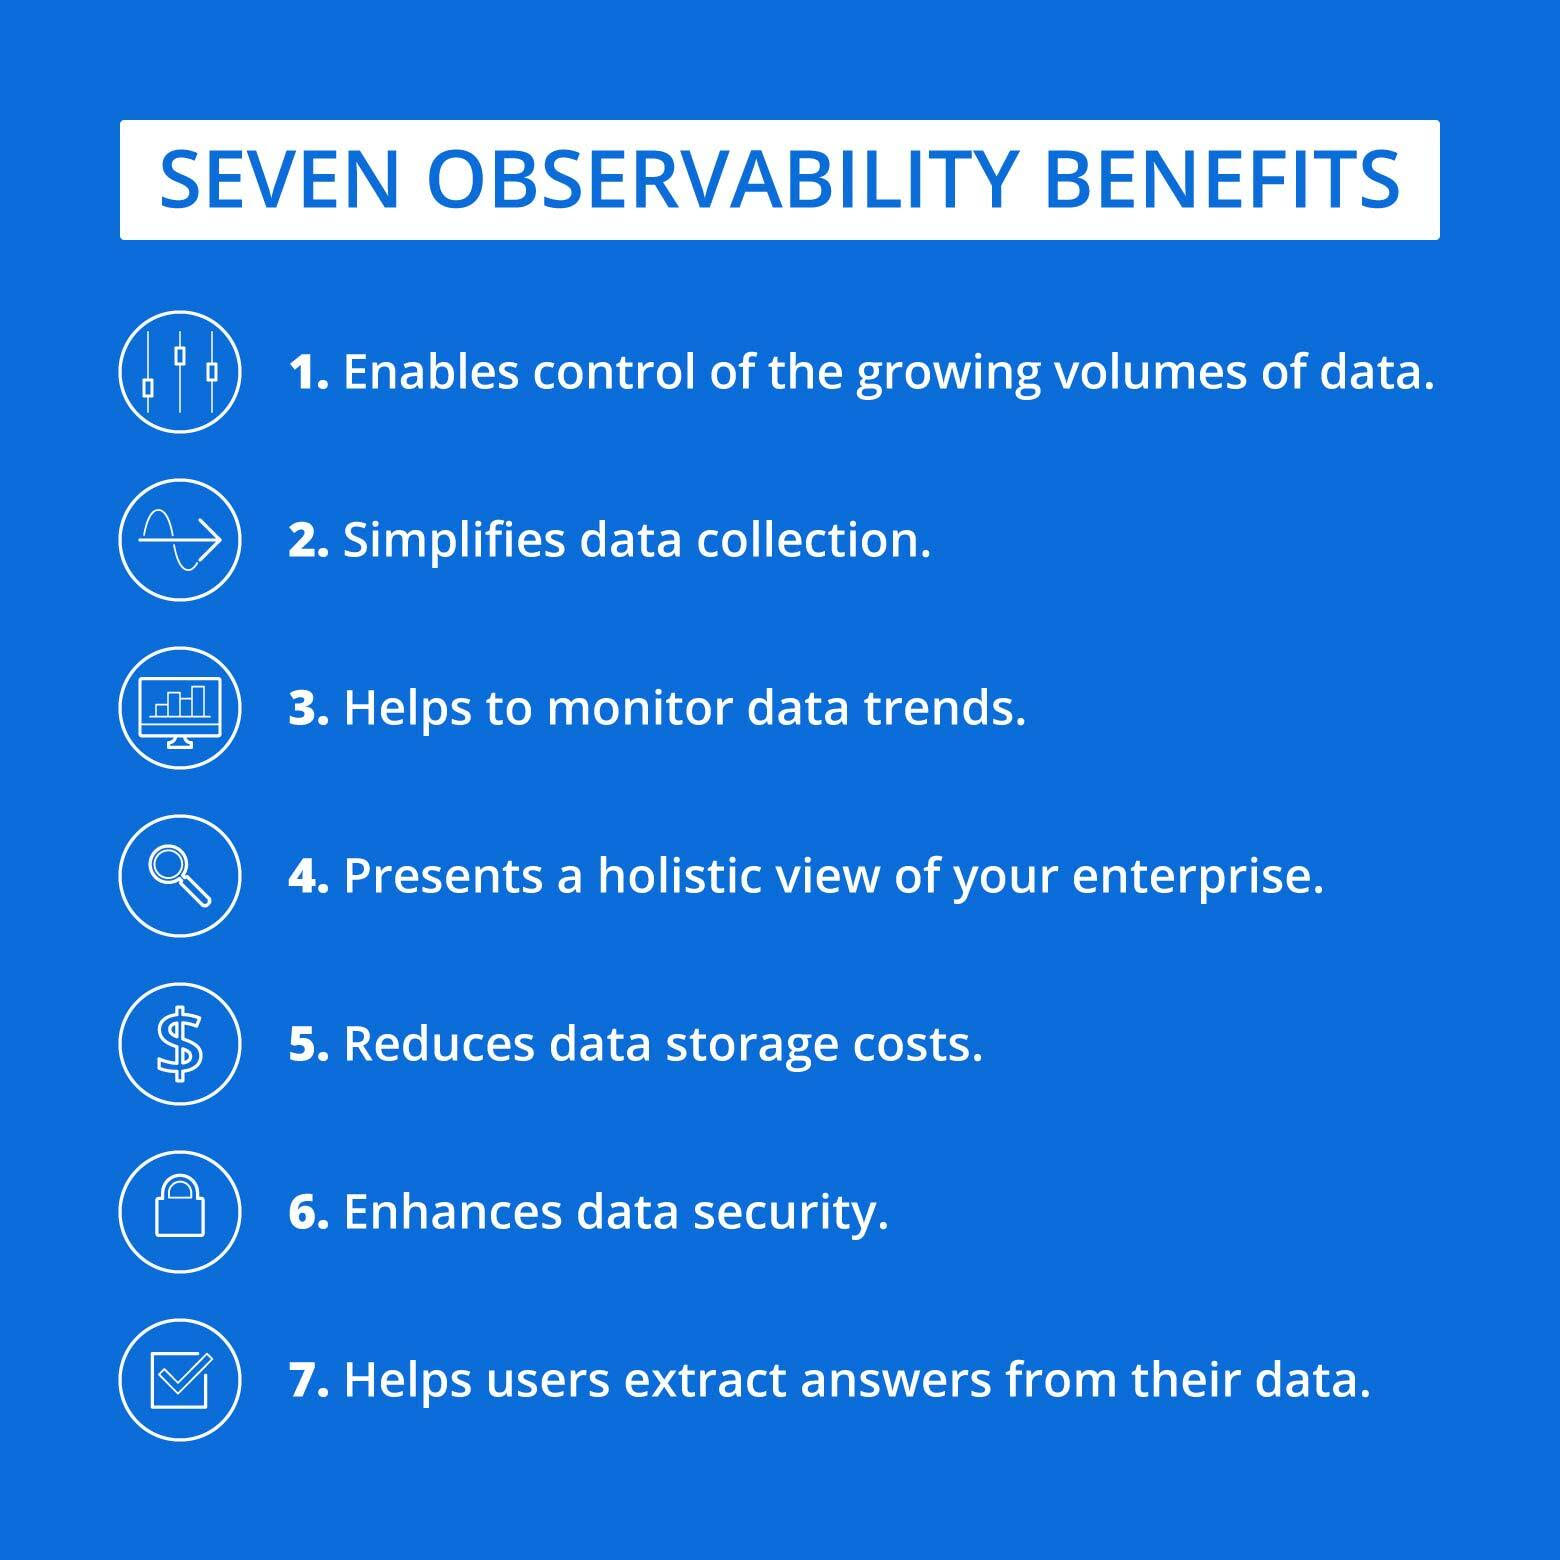
Image source: Cribl
Table of Contents
- Introduction
- What is data observability and why is it important?
- What is data pipeline monitoring?
- The importance of data-driven decision making
- The consequences of inferior data quality
- What are the 5 Pillars of data observability?
- Data observability vs data monitoring
- Data observability is essential to DevOps as well as DataOps
- In Summary
Introduction
In 2006, Clive Robert Humby, a British mathematician, data science entrepreneur and expert in customer-centered business strategies, came up with the phrase 'Data is the new oil'.
While it may have been insightful at the time, and data became something to be extracted, accumulated, and used (or misused), the digital revolution has rendered Humby’s insight more of a cliché.
In today's new data economy, and with many lessons learned along the way, data isn’t just a resource to be carelessly extracted from consumers and hoarded. The value of data, and the way we use it today is more like a currency, mutually beneficial to businesses and consumers and used to build exceptional experiences.
What is data observability and why is it important?
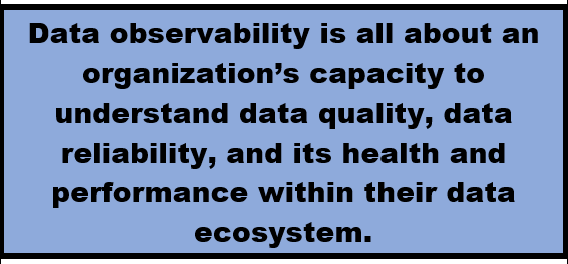
Data observability is all about an organization’s capacity to understand data quality, data reliability, and its health and performance within their data ecosystem.
In order to do this, reliable, quality data observability tools are essential to keep up with the incredible speed at which data is evolving.
Data observability tools use AI and machine learning technology to create data observability platforms to monitor for data anomalies and alerting, as well as all-important data lineage.
Data lineage is a type of metadata that maps relationships between upstream and downstream flows in your data pipelines. In other words, tracing where your data originates, the way it changes as it moves throughout your data pipelines, and where it finally arrives in relation to your end consumers. We'll cover more about lineage later in this guide.
But in real terms, what does data observability bring to your organization? And who in your organization most benefits from data observability? Let's take a look at how deep data observability can extend inside an organization, and how many people on the inside, as well as the outside can benefit from it.
Data Observability and its importance to data managers
It's the job of data managers to oversee an enterprise organization’s data system. Their role includes responsibility for storing, organizing, and analyzing the organization’s data in an efficient, effective and secure way.
A data manager uses observability to keep data flowing efficiently through the pipeline. Their primary concern is the entire health of the data management system, fine-tuning the data pipeline, and benefiting data management.
Data Observability and its importance to data engineers
Data engineering teams are tasked with overseeing their organization's investment in up-to-the-minute data handling and analytics tools.
They have the job of managing data, designing, building, and maintaining the data architecture and ecosystem necessary within an organization for storing, processing, and analyzing the large data volumes that pass through their systems every day.
They are responsible for utilizing their data observability tools to ensure healthier data pipelines and enhanced data management practices.
Data observability helps engineers improve existing systems and to build and maintain more efficient systems in the future.
Data Observability and its importance to data scientists
Much like a tech detective, a data scientist uses data to solve complex problems, using various skills such as maths, computer science, data analysis, and others to identify critical issues and mitigate them.
A data scientist depends on data observability to design the smooth-running and constantly evolving data systems that extract meaning from huge volumes of data.
Data Observability and its importance to data analysts
A data analyst's role is similar to a data scientist, but more focused on immediate real-world issues. A data analyst examines the collected data, and produces actionable insights that benefit operational and strategic business decisions.
A data analyst depends on data observability to ensure the availability of clean and accurate data to analyze.
Data Observability and its importance to DevOps teams
The role of DevOps is to link formerly siloed data teams and help them work together to the benefit of both the organization and its customers.
DevOps depends on constant, robust data observability to continuously monitor the state of their systems and data. Data observability provides the real time data monitoring and data analysis that is required by DevOps. DevOps teams use the key drivers of data observability to gain actionable insights into data movement, data reliability, and data quality.
This equips data teams with the information they need to predict future behaviors and make better-informed strategic designs.
Data Observability and its importance to management
Management would be unable to make informed decisions or benefit from efficient and effective product development without the insights harvested by data analysts, data scientists and DevOps teams. Working in tandem, all the roles mentioned above benefit from data observability, and this makes management the biggest beneficiary of what data observability brings to an organization.
What makes data observability important is that it produces a higher data quality, and this follows on to better decision-making.
What is data pipeline monitoring?
Data pipelines are like the pipelines of the real world that transport liquids, gases or solids from one point to another. Data pipelines work in the same way, directing data assets from various data sources to a data warehouse.
But data pipelines also present many challenges in terms of reliability, performance, and quality, so they need to be monitored.
The first steps in data pipeline monitoring are
-
Define the metrics and alerts you want to monitor.
-
Use a data monitoring tool or platform that can collect, store, visualize, and analyze your metrics and alerts.
-
Implement logging and tracing to help you identify issues, errors, and bottlenecks in your data pipeline.
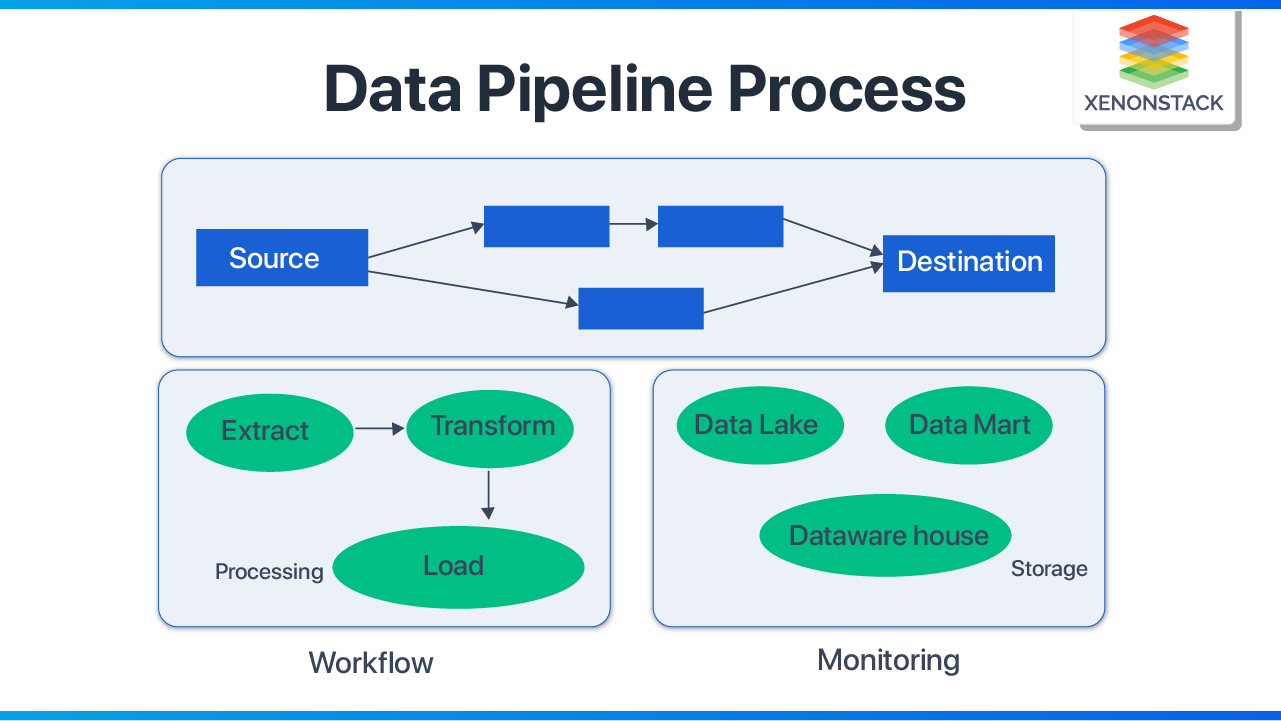
Image source: Xenon Stack
The importance of data-driven decision making
Data observability is at the heart of the modern data stack, and drives data-driven decision making - the use of facts extracted from data sources, rather than biases and hunches to back up important enterprise business decisions.

Image source: Kyinbridges
The most informed decisions stem from data sources that measure business goals. For example:
-
Driving sales and profits
-
Creating a better management culture
-
Optimizing operations
-
Improving team performance
But poor quality data is a pain point for data engineers and analysts involved with the workflows and data pipelines responsible for transforming and visualizing it. It refers to inaccurate, missing and erroneous data, and is also called data downtime.
The consequences of inferior data quality
As we'll see in the examples below, a data observability platform can save an organization from disaster. The following scenarios are actual business catastrophes that came about because of poor data quality:
-
In 2022, global credit giant Equifax gave the wrong credit scores to millions of customers due to a Machine Learning model processing bad data. The error resulted in a 5% stock drop the very day after the incident.
-
Unity Technologies, a publicly-traded video game software development company, lost $110 million in revenue because bad data from a large customer was fed into its Machine Learning algorithm, which helps place ads and allows users to monetize their games.
Gartner estimates that poor data quality costs companies nearly $13 million per year, while Harvard Business Review finds that data professionals spend about half of their time fixing their organization's data issues.
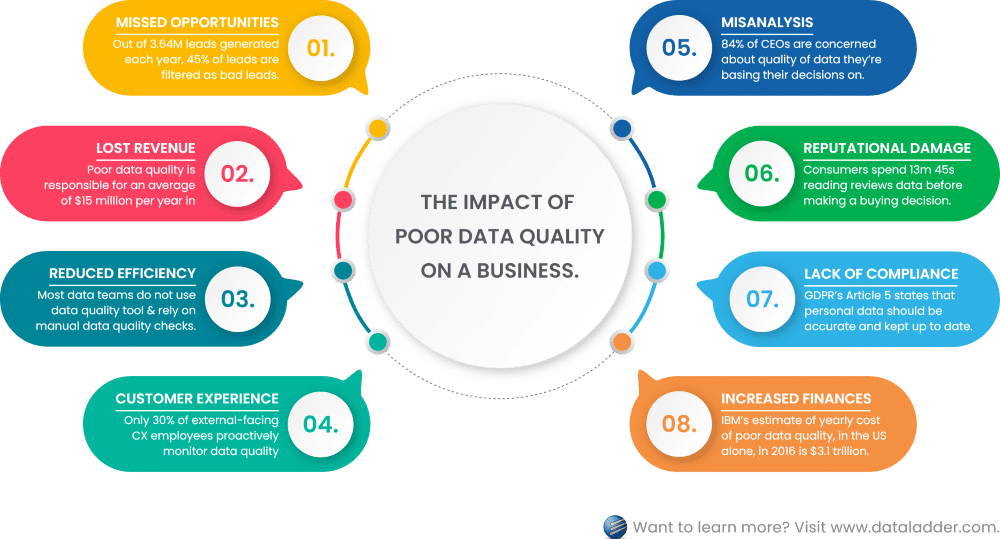
Image source: DataLadder
Data observability is the only way that data teams within enterprise organizations can properly understand the impact of inferior data quality as well as what causes it - both of which are critical to preventing, repairing and lessening the impact. In other words, a data observability platform is the only way to future-proof your organization.
Data silos are another factor that can prevent the seamless connection of all of an organization's systems. Your data observability tool can integrate all the data sources from within data silos and help data teams to standardize their metrics, logs and traces across data lakes and warehouses.

What are the 5 Pillars of data observability?
Data pipelines are becoming larger and more complex, as the volume of data assets collected and analyzed by companies continues to balloon.
A data observability tool monitors for potential issues throughout the data pipeline and alerts data management teams about necessary interventions.
The three core elements of data observability are metrics, logs and traces. These elements become more effective and overall data quality improves by focusing on its own 5 pillars of observability.
Each pillar covers a specific aspect of data monitoring and directly relates to the other four pillars:
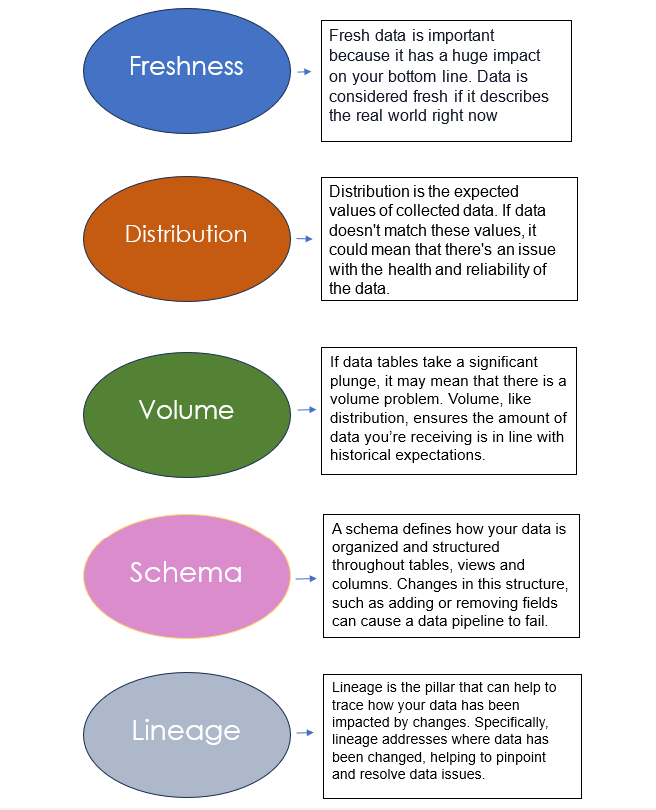
1. Freshness
Data freshness is a term that directly relates to the timeliness and relevance of data in a system or data warehouse. Accurate, relevant, up-to-date real time decision-making and analysis is dependent on data freshness.
Freshness directly relates to data quality, and also refers to how current your data tables are, as well as the regularity with which your tables are updated. Freshness is important because stale data equates to wasted time and money.
For example, during a business day if a particular pipeline is expected to ingest several thousands of records per hour, but you discover that instead it's consuming only hundreds or dozens, freshness measures can help alert you to those scenarios.
There are some key metrics to consider for data freshness that serve to make certain that your decisions are grounded in the most relevant and up-to-date information available.
-
Latency and processing time
Data latency means how long data takes to travel from its source to the point of analysis. Lower latency means fresher data. However, before it can become useful and ready to analyse, data requires processing, validating and cleaning.
-
Timestamps and frequency of collection
Each data point is closely linked with a timestamp, revealing when it was generated, collected, or recorded. The closer the timestamp is to real time, the fresher the data. Additionally, the more often data is collected, the more relevant, usable insights.
-
Monitoring and alerts
Monitoring systems are a crucial part of maintaining data quality and freshness. These systems constantly for freshness and trigger alerts when freshness levels vary from pre-defined thresholds.
2. Distribution
Distribution in data observability refers to the expected range and parameters of a set of data. If data points do not land within this range, it could mean that there are data reliability and accuracy issues.
Once inaccurate or incorrect data finds its way into the pipeline it can continue through different parts of the organization and compromise decision-making. Distribution uses data observability to identify data quality issues and records what to expect of your data values to recognize when data is unreliable.
3.Volume
Volume as it pertains to data observability deals with the amount of data and the completeness of data tables in a file or database. It provides insights on data quality and data health, and is one of the most vital measurements for whether or not your data intake is meeting expected thresholds.
An analogy for data professionals would be if 100 million rows in a table suddenly became 2 million, this would be cause for concern and action.
4. Schema
Schema in data observability monitors for anomalies in the organization of data, and for breaks and changes in the table. If data columns or rows are moved, changed, modified or deleted, it can disrupt data operations. In larger more complex databases, it can become more difficult for data teams to determine accurately where the break could be and to fix data issues, so a data observability framework is essential.
5. Lineage
Lineage in data observability, as we've touched on earlier, is the largest and one of the most important of the pillars because it encompasses the entirety of the data pipeline.
It maps out the pipeline, so that you can see the whole data journey. This encompasses where data sources originate, where it goes, where it's stored and processed, and the users who eventually receive it.
Understanding the history, or lineage of your data is incredibly valuable for data teams as a key measure to avoiding data downtime. For example, if you see a sales figure in a report, and need to pinpoint where that figure came from, where it was stored, and when it was produced.
Another way to describe lineage is to use the analogy of a passport, with the time-stamps indicating the specific countries you've visited. In the same way, each data element has a journey through the systems of a company. Lineage time-stamps the entire journey, showing where it was first entered, and when or if it has been copied to other systems.

Image source: Credencys
Data observability vs data monitoring
While they are both a major part of data quality improvement efforts, data observability vs data monitoring are two terms that are often used interchangeably, but are quite different.
Together, observability and monitoring provide a comprehensive view of an organization's IT infrastructure.
Monitoring is the early warning system and observability identifies the source of the issue and how to fix it.
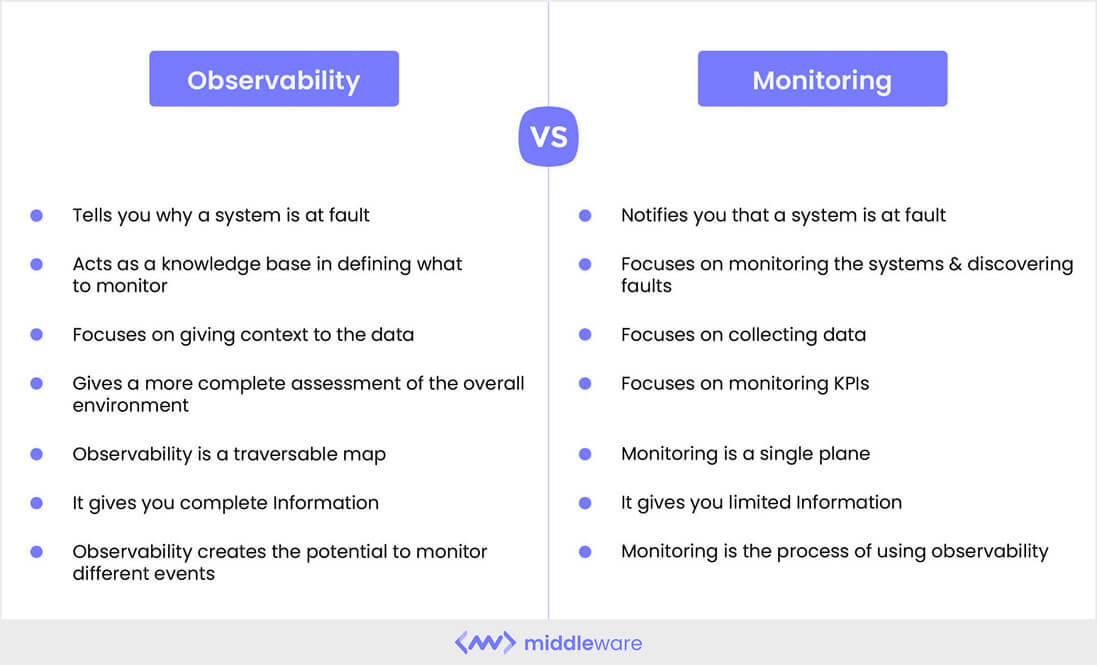
Image source: Middleware
Data observability is essential to DevOps as well as DataOps
DataOps and DevOps teams both have their own unique set of skills when assigned to address the different aspects of the 5 pillars of data observability.
DevOps is focused on software development and deployment, and DataOps is focused on data processing and analytics. But data observability provides vital information and insights about data quality and data health that benefits both DevOps and DataOps.
Developer Operations teams have become an integral component of most engineering organizations, removing silos between software developers and IT, facilitating the seamless and reliable
When DevOps and DataOps teams implement data observability, they can jointly minimize data downtime, which can cost organizations dearly.
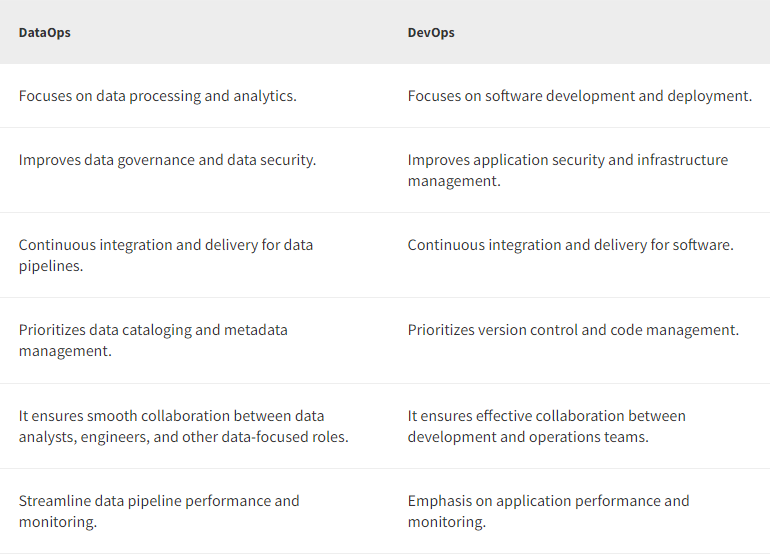
Image source: Browserstack
Find out how to keep your IT systems working at optimum capacity.
In Summary
Data observability provides details about the health and quality of data throughout an organization. It provides a nuanced understanding of the health of data at rest and in motion.
Data observability enhances data pipelines
Observability in relation to data pipelines means the ability to monitor, measure data quality and understand the state of a pipeline at any point. But observability goes beyond monitoring to provide a deeper understanding of how data is moving and being transformed in a pipeline, and is often associated with metrics, logging, and tracing.
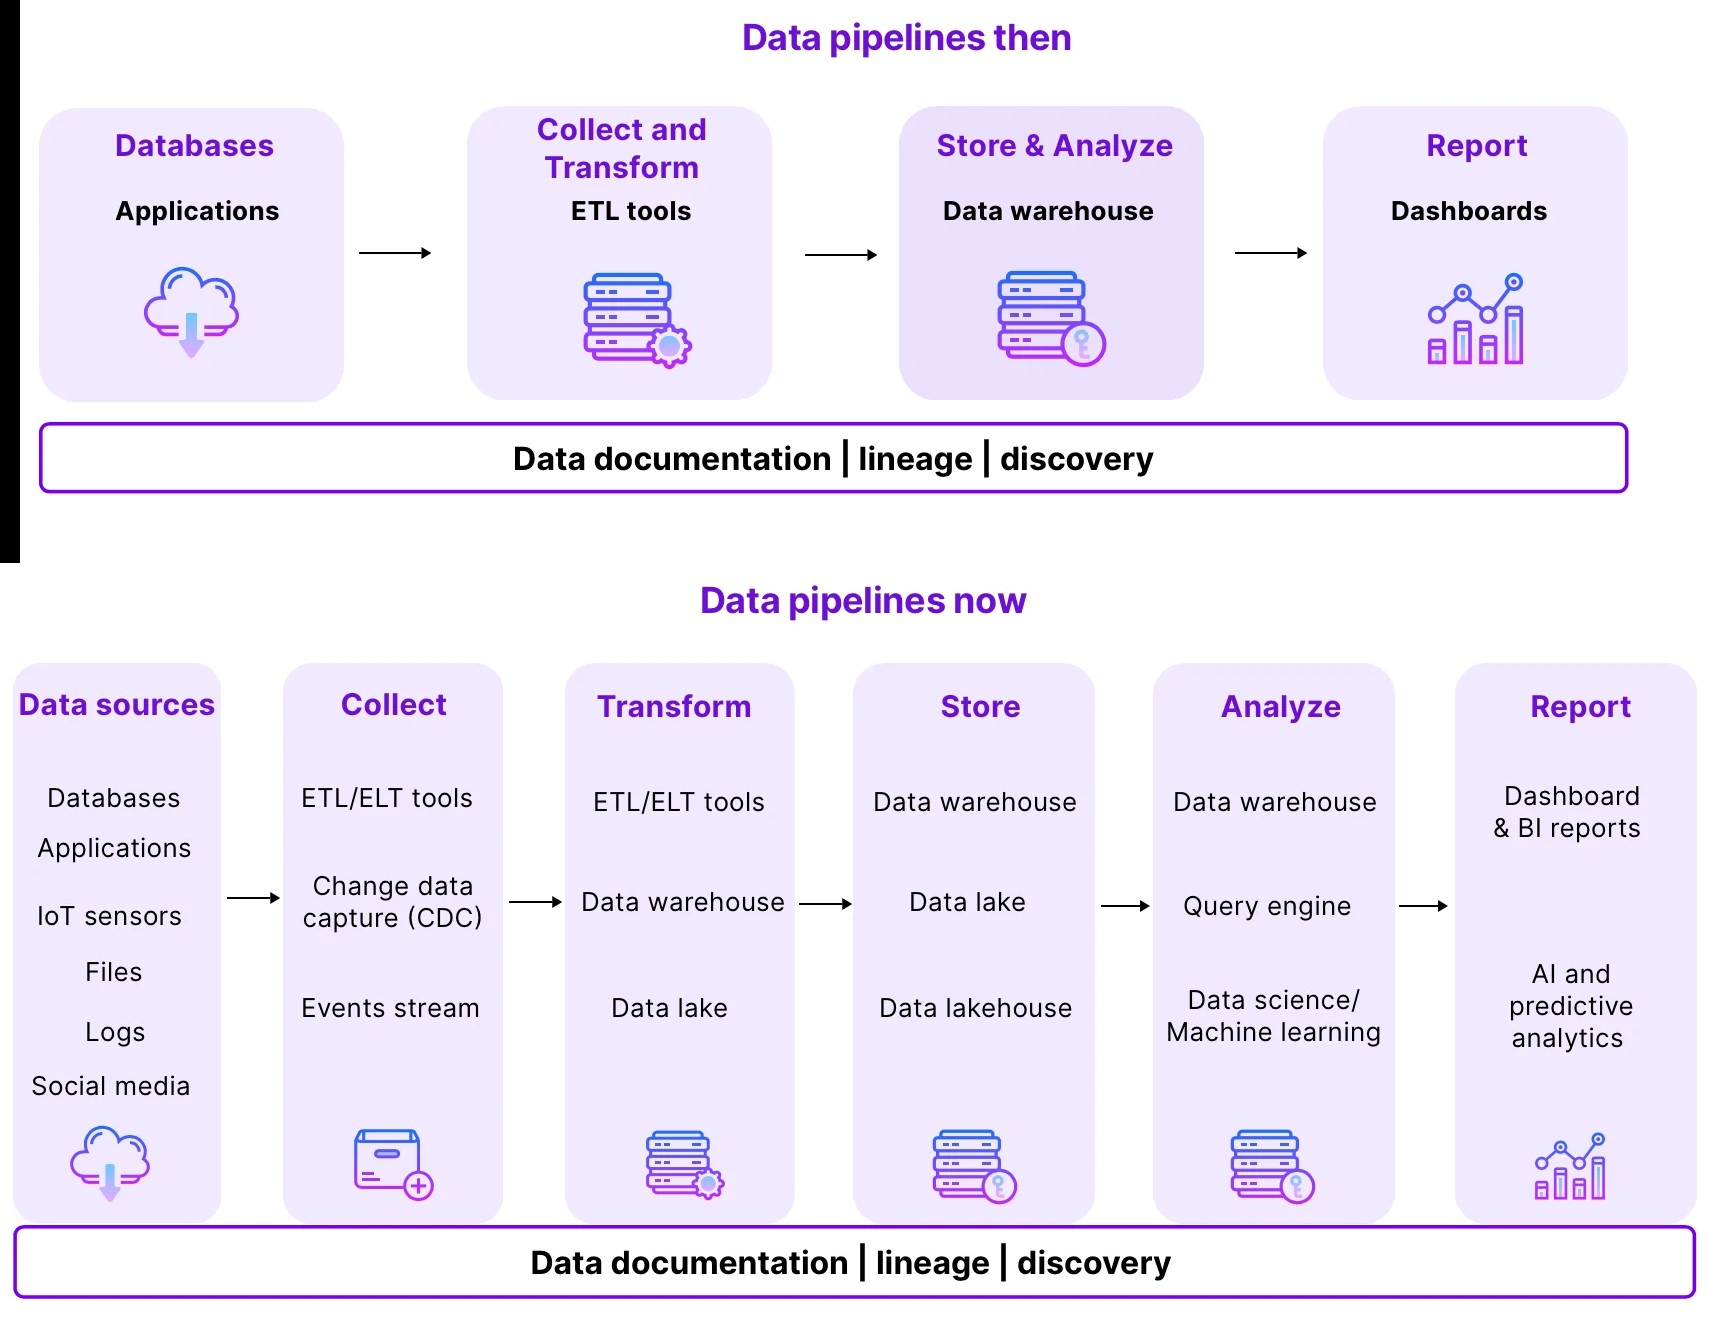
Image source: Castordoc
Data observability helps timely delivery of quality data for business workloads
Data observability is more than monitoring and alerting. It enables organizations to understand their data systems and data quality and allows them to fix and identify data quality issues early. This is invaluable for organizations with heavy workloads who rely on data for decision-making.
Data observability vs. data testing
Both data testing and observability are essential to mitigate the issue of poor quality data
-
Data testing can identify and fix individual pieces of bad data
-
Data observability software can ensure the integrity of your entire data system.
-
Data testing looks at individual pieces of data for incompleteness and other erroneous issues
-
Data observability looks at the whole pipeline for flaws that affect all the data flowing through it
-
Both data testing and data observability differ in terms of coverage, scalability, focus, and speed
-
Organizations need both testing and observability to ensure the highest quality data possible
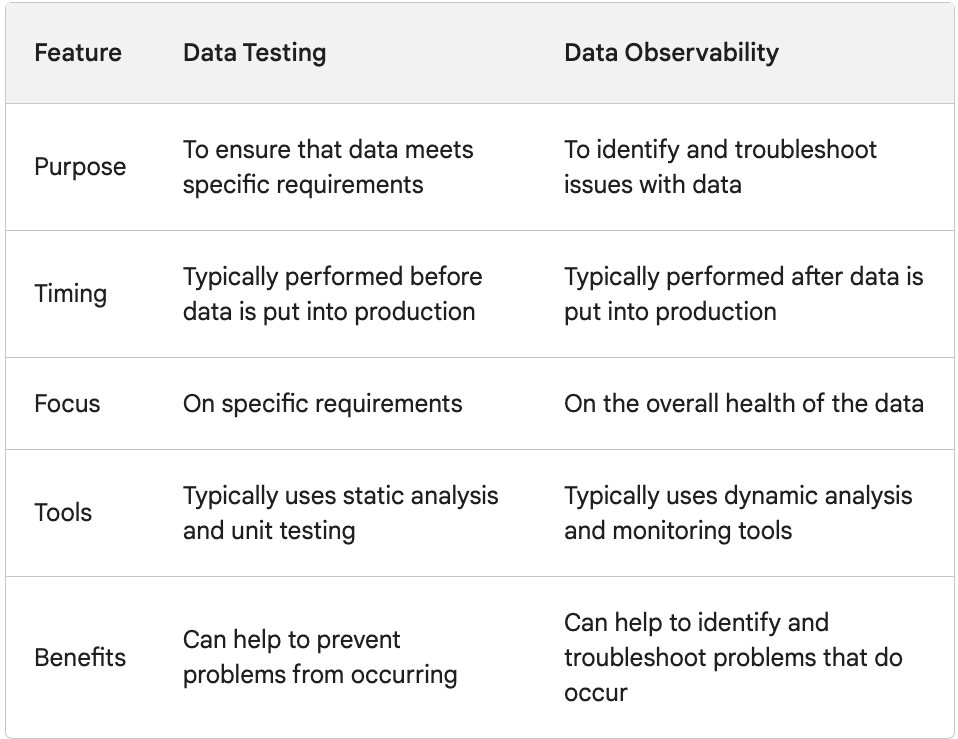
Image source: Data Engineering weekly
Data lineage: Mapping dependencies between data systems
Tracking and mapping data elements from one system or process to another helps correlate connections between different data sources and destinations, allowing organizations to better analyze and understand data dependencies.
A data observability solution can help control cloud data costs
Implementing data observability tools, means data teams can get insights for faster issue resolution and optimization of system resources, including elements like CPU, storage, and memory. With this knowledge, IT teams can make informed capacity planning decisions, leading to smarter resource allocation and cost savings.
Data teams today are faced with many challenges. Due to the rising complexity of the data stack, and the rising incidence of data downtime, a data observability platform is essential for enterprise organizations.
As data observability is now in the limelight as a critical concern for data teams, evaluating your 5 pillars of data observability by implementing the right data quality monitoring tools can help achieve good data quality and mitigate data downtime.

Image source: Cribl
Why choose IR Collaborate as part of your data monitoring system?
Monitoring, together with data observability are a set of capabilities that drive better data quality, increased software performance, optimal user experience and organizational output.
Finding and solving a problem within your IT infrastructure, and resolving it quickly is essential for business operations. But the key to quickly and efficiently locating issues is having comprehensive monitoring tools on hand to identify problems in real time.
More than 1,000 organizations in over 60+ countries - including some of the world’s largest banks, airlines and telecommunications companies rely on IR Collaborate to provide business critical monitoring and insights and ensure optimal performance and user experience for their customers across the globe 24x7.
Having problems with network congestion? Find out what causes it and how to fix it


