


.png?width=141&height=141&name=Transact%20(1).png)






.svg)

.svg)
.svg)
.svg)


%201.svg)
















Traditional monitoring alone is no longer enough.
Compared to even a decade ago, today's IT infrastructures are like something from another world. Enterprises that have adopted cloud-native technologies now manage complex distributed systems where application design changes all the time.
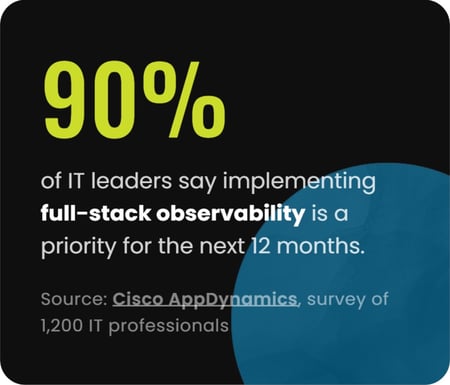
IT teams are discovering that traditional monitoring tools alone are no longer adequate. Modern applications are built to be agile — adjusting to changing business needs, service level objectives and multi-cloud ecosystems — but teams that invested heavily in complex systems find their existing strategies deliver only limited insight amid spiraling costs.
Through observability, IT teams can accurately measure, monitor and analyze the health, performance and status of software systems based on their external outputs. A system is observable when you can determine its current state using only the information from its outputs.
Download a PDF of our guide on the Value of System Observability
Observability vs. Monitoring
Two Terms, Two Very Different Jobs
The words are often used interchangeably, but they describe different capabilities that complement one another.
MonitoringObserves a system's performance in real time, over a period of time. Monitoring tools collect and analyze performance data, then translate it into actionable insights. It tells you when something is broken. |
ObservabilityAddresses the internal state of a system from its external output. It uses the data monitoring produces to give a deep understanding of the whole system — performance and overall health — and reveals why something broke. |
Control theory underpins both: by measuring internal states from external outputs — through feedback loops and error correction — teams keep complex digital systems stable, predictable and performing optimally.
The Three Pillars of Observability
Observability uses three basic types of telemetry data to gain deep visibility into a distributed system and find the root cause of issues. Unified, they build a comprehensive picture — and address the "unknown unknowns."
-
Metrics: Numeric measures of behavior over time — CPU utilization, latency, network traffic, user signups — giving real-time insight into the performance and health of a system, and triggering alerts when a value deviates from threshold.
-
Logs: Structured and unstructured records a system produces in response to events. They show when a problem occurred and which events correlate with it — the historical record behind an incident.
-
Traces: Follow the end-to-end flow of a request through every component. Tracing surfaces the source of issues and identifies root cause — even across microservices and containers.
The Benefits of Observability
Actionable Insight Across a Complex Stack
A unified observability platform gives stakeholders across the enterprise actionable insight into an increasingly multilayered, distributed infrastructure.
-
Comprehensive Insights: Find and fix problems quickly and see what changed — reducing Mean Time To Detect (MTTD).
-
Agile Development: Push applications faster with fewer problems, less downtime and better correlation of incident data.
-
Monitor Trends: Proactively track how systems perform, predicting and preventing recurring issues.
-
Foresee a Breach: Get advance warning of looming threats and regain control before it's too late.
Real-time analysis turns live data into live decisions — instant inventory visibility for eCommerce, immediate fraud alerts for banking, and a dynamic view that continually improves the customer experience.
Best Practices to Achieve System Observability
Four Disciplines for Sustained Visibility
-
Know Your Platform: Understand its components, dependencies and communication patterns, the workloads it runs, and its performance characteristics and limitations.
-
Decide What to Monitor: Platforms generate huge data volumes, but not all of it is useful. Filter close to the source, at multiple levels, to avoid clutter.
-
Alert Only on Critical Events: Let machine learning correlate and prioritize incident data, filtering alert noise so developers know exactly when action is required.
-
Customize Your Dashboards: Default dashboards miss what makes each system unique. Custom views surface the metrics specific to your critical components.
How IR Collaborate Can Help
Monitoring and Observability, Together
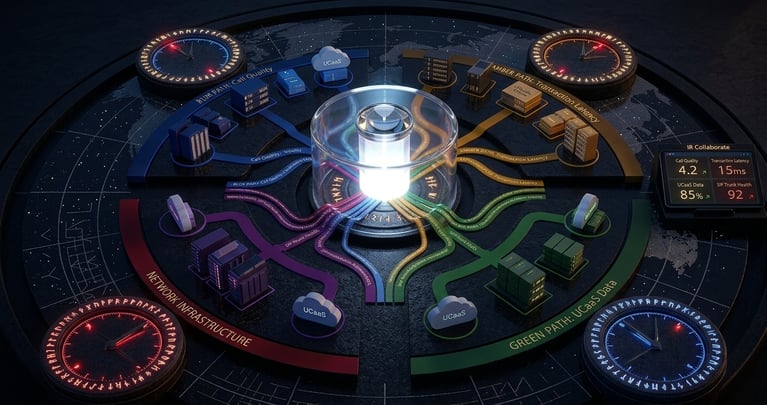
Finding and resolving a problem quickly is critical to business operations — and the key is comprehensive tooling that identifies issues in real time. IR Collaborate delivers both.
- Monitor & Troubleshoot: Find and fix root causes fast to maximize performance and minimize user impact.
- Single Pane of Glass: One dashboard for end-to-end visibility across your entire IT environment.
- Deploy Your Way: Cloud, on-premises or hybrid — versatile deployment to suit your environment.
Turn System Data Into Business Advantage
See how IR Collaborate gives you monitoring and observability in a single platform — and complete visibility across your environment.

Download a PDF of our guide on the Value of System Observability