
.png?width=141&height=141&name=Transact%20(1).png)


In 2026, observability has become non-negotiable as a key success factor for every enterprise organization.
At enterprise level, organizations globally are integrating AI models into their IT systems, creating a new-age tech stack that comes with hugely increased data volumes, and complex data pipelines. This shift demands observability solutions that operate at enterprise scale, ensuring reliable performance, scalable ingestion, and analytics to meet the needs of large and complex environments.
To leverage all this data effectively, it’s crucial to use tools and processes that optimize business outcomes and system performance. Effective enterprise observability enables organizations to achieve real business outcomes by breaking down data silos, improving data quality, and supporting operational excellence.
This guide explores what enterprise observability means in 2026, why leading organizations are investing heavily in observability capabilities, and how to build an observability strategy that delivers measurable business outcomes.
What is enterprise observability?
Data observability tools enable organizations to proactively manage performance, and resolve issues much faster than any traditional monitoring tools.
Observability solutions provide comprehensive visibility into data pipelines, ensuring that data engineers and IT teams can trust the information flowing through their systems.
Observability enables teams to access logs, metrics, and traces from the same data source, allowing for faster incident detection, proactive problem prevention, and improved collaboration across distributed teams.
Schema consistency is also critical in maintaining data quality and system reliability, as it ensures data schemas remain uniform and adhere to standards over time.
But observability is only as good as the quality of its data.
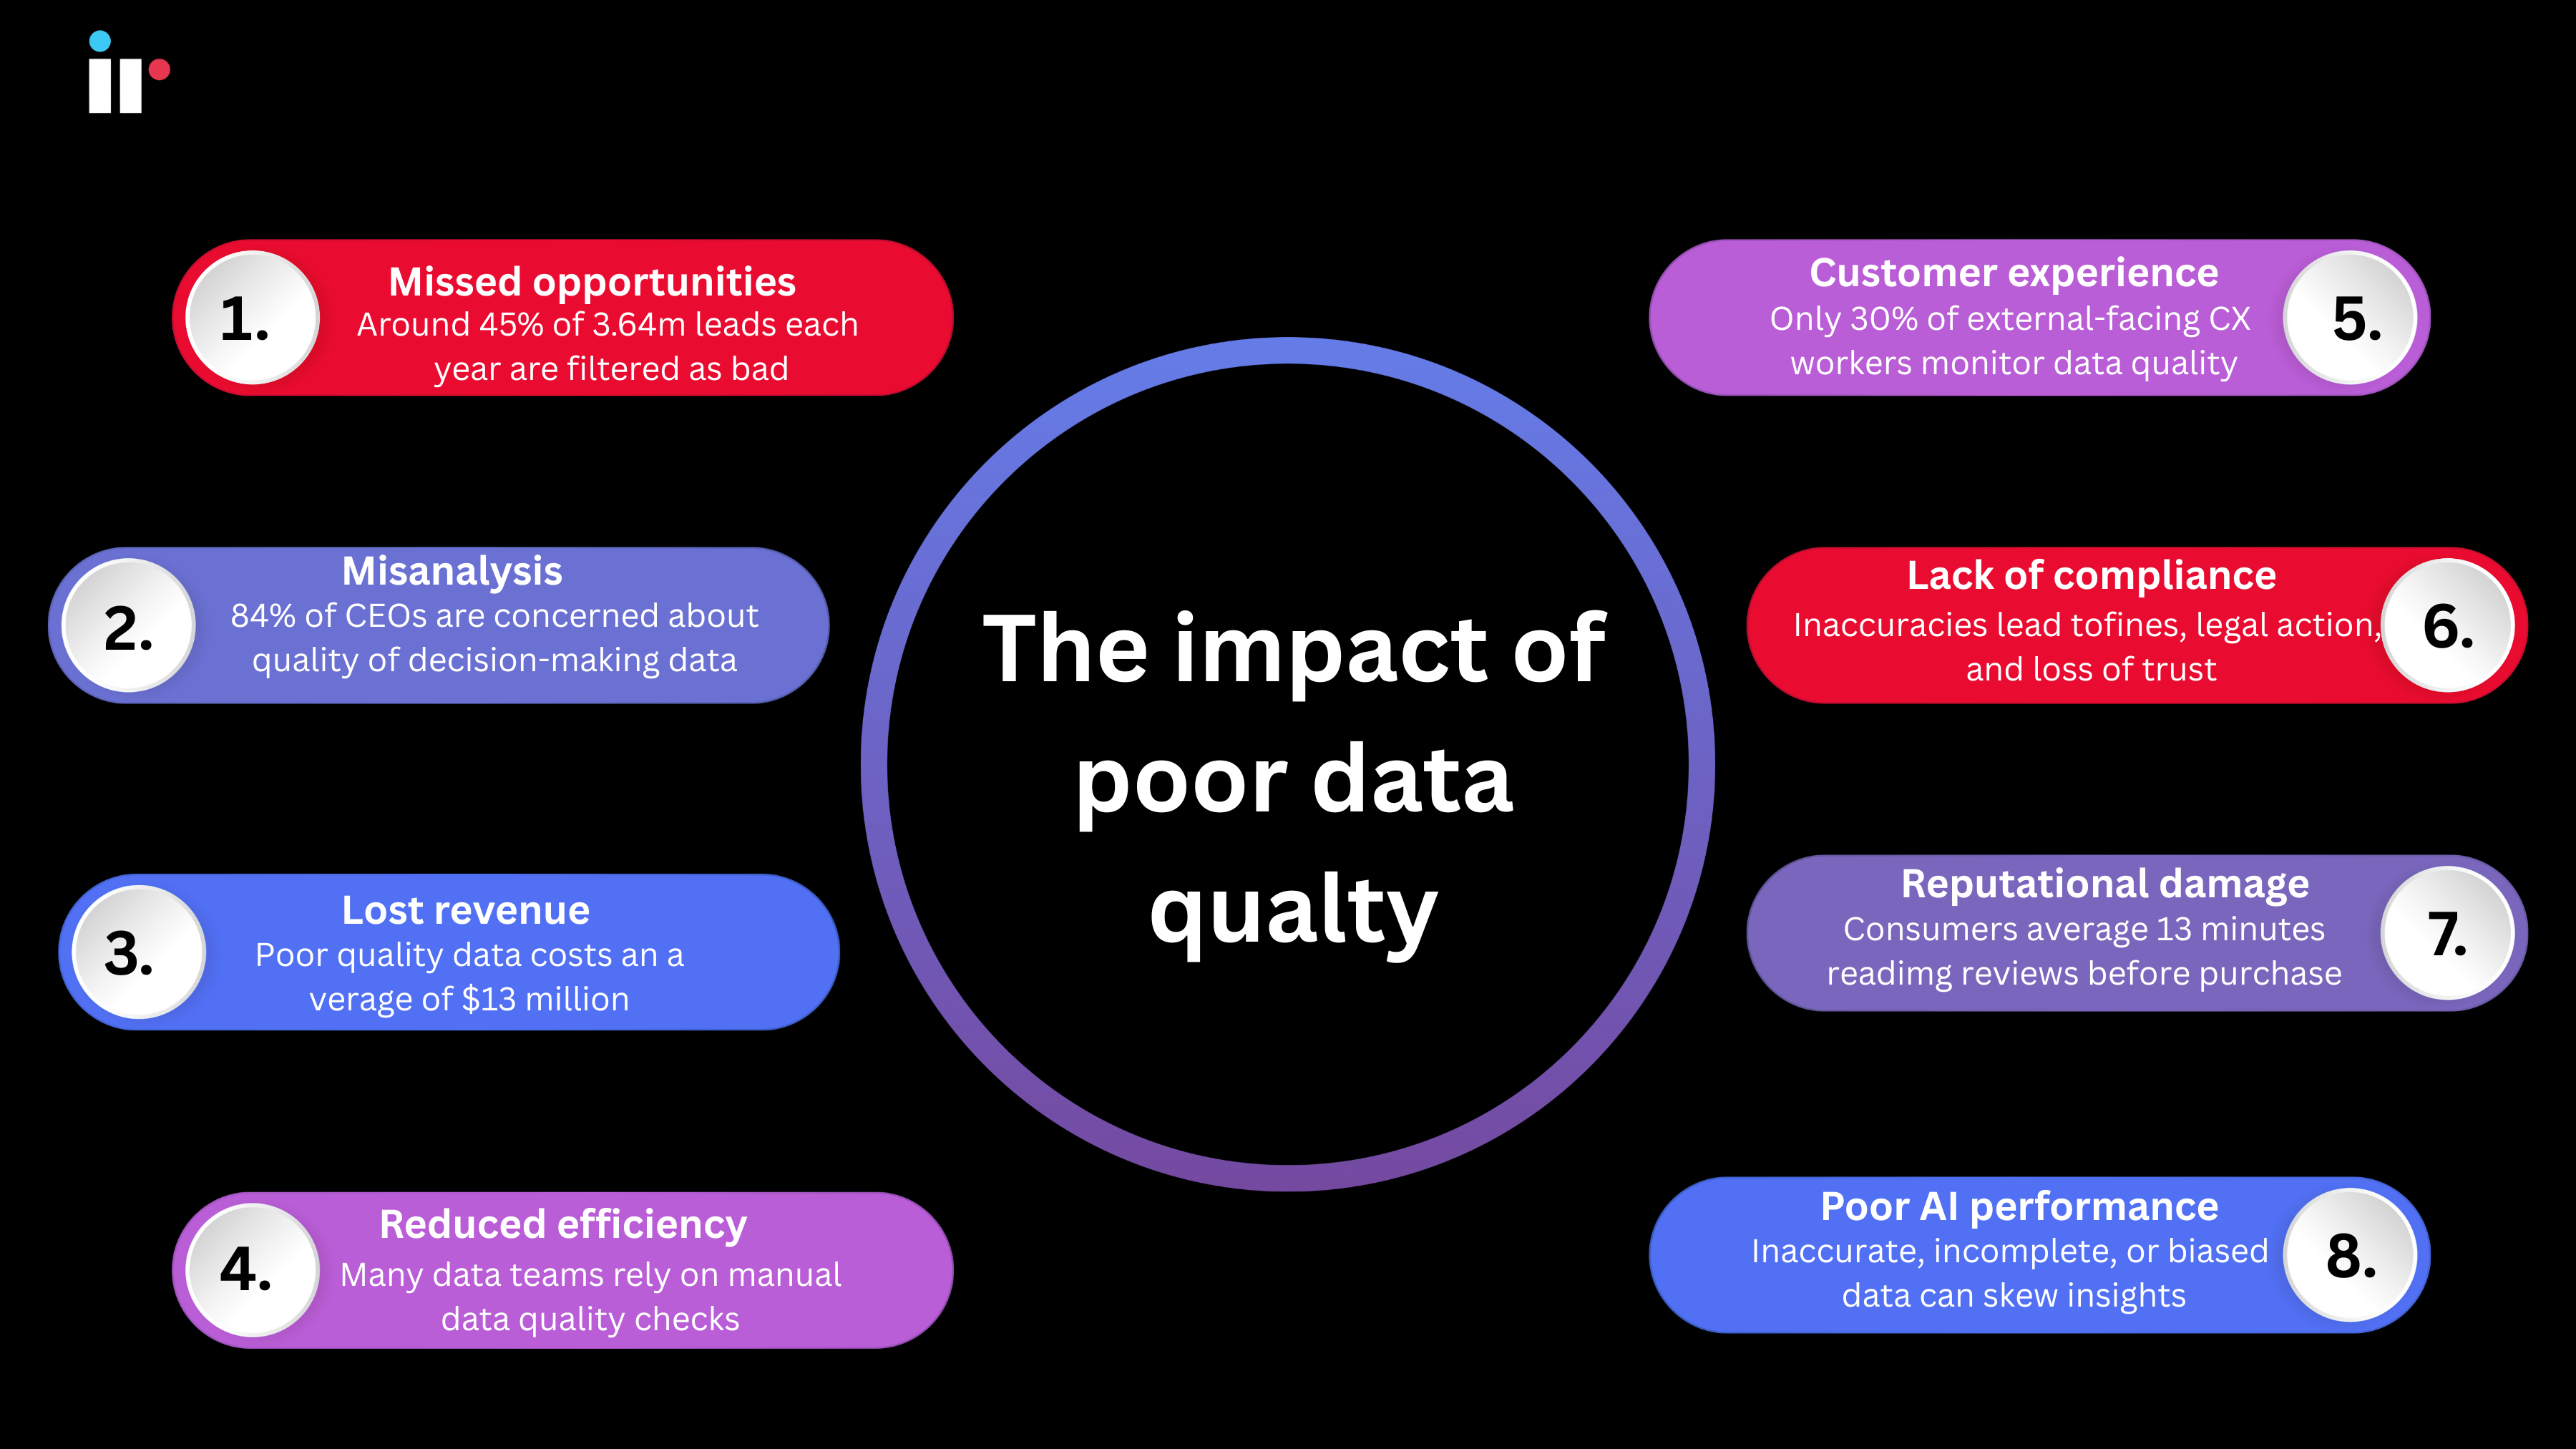
Bad data costs organizations
According to Gartner, poor data quality costs enterprise organizations an average of $12.9 million to $15 million annually in wasted resources, missed opportunities, and operational inefficiencies. Increased operational costs, infrastructure costs, and storage costs are direct consequences of persistent data issues, compounding the financial impact on organizations.
An MIT Sloan Management Review suggests bad data can cost 15-25% of a company’s total revenue.
Data consistency and data reliability are crucial elements that impact an organization’s bottom line. Bad data pipelines cause inaccurate analytics, reducing productivity, resulting in poor customer experiences, and increasing compliance risks.
Data observability tools provide deep visibility into the health and performance of the systems, pipelines, and infrastructure that move and process data. This allows organizations to proactively address issues in real time.
Key Takeaways: What is Enterprise Observability?
- What it is: Comprehensive visibility into complex technology environments and data operations through unified collection and analysis of metrics, logs, and traces across all systems and services.
- Why it matters: Modern applications are too complex for traditional monitoring. Business users need observability to maintain reliability, reduce downtime, improve customer experience, and make informed decisions about technology investments.
- Core benefits: Faster incident detection and resolution (reducing MTTR by 40-60%), proactive problem prevention through predictive insights, better understanding of user journeys, and correlation between technical performance and business outcomes.
- Key capabilities: Real-time data collection across distributed systems, continuous monitoring, automated anomaly detection, automated alerts for real-time notification of issues, automated root cause analysis, natural language querying, and integration with existing tools and workflows.
- Strategic value: Organizations with mature observability practices report significant operational improvements including reduced incident frequency, faster resolution times, improved customer satisfaction, and better resource utilization.
What are the benefits of enterprise observability?
Enterprise observability delivers measurable value across operational efficiency, system reliability, and business outcomes. By providing reliable, real-time insights, enterprise observability directly enhances business intelligence, empowering better decision-making and supporting increased revenue.
Let’s examine the specific benefits driving investment in data observability platforms. Observability tools also streamline debugging and enable self-service dashboards, resulting in improved developer productivity as developers spend less time troubleshooting and more time coding.
1. Proactive problem prevention
Traditional monitoring operates reactively, alerting teams after problems occur and users experience impact. Enterprise observability enables proactive operations by identifying issues before they affect customers.
How it works: Machine learning algorithms establish dynamic baselines for normal system behavior across metrics, logs, and traces. When data patterns deviate from expected norms, even subtly, observability platforms flag potential issues with context about what's changing and why it matters.
Real-world impact: For unified communications environments, observability might detect gradual bandwidth saturation trends days before a scheduled company-wide video conference, giving IT teams time to provision additional capacity. For payment systems, observability can identify increasing transaction processing times that signal approaching capacity limits, enabling proactive scaling before authorization failures occur.
Measurable outcomes: Organizations implementing proactive observability report 50-70% reduction in user-impacting incidents through early detection and prevention.
2. Faster incident detection and resolution
When incidents do occur, speed matters. Every minute of downtime costs money, damages reputation, and erodes customer trust. Enterprise observability dramatically accelerates both detection and resolution.
Faster detection: Unified visibility across all systems means anomalies are detected within seconds or minutes rather than waiting for user complaints. Real-time correlation identifies issues as they emerge rather than after cascading failures make impact obvious.
Faster resolution: Automated root cause analysis eliminates hours of manual investigation. Instead of checking multiple dashboards, searching logs, and correlating events across systems, engineers receive ranked probable causes with supporting evidence from multiple data sources.
Measurable outcomes: Research shows enterprises using AI-driven observability reduce Mean Time to Repair (MTTR) by approximately 40-60%. What previously took 2-3 hours of manual investigation now happens in minutes, allowing teams to move directly to remediation.
|
Metric |
Traditional Monitoring |
Enterprise Observability |
|
Incident Detection |
15-60 minutes (after user reports) |
Seconds to minutes (automated) |
|
Root Cause Identification |
1-3 hours (manual investigation) |
Minutes (automated analysis) |
|
Mean Time to Repair (MTTR) |
2-4 hours |
45-90 minutes |
|
False Positive Rate |
40-60% |
<10% (with tuned AI) |
Read more on How to Reduce MTTR with AI: A 2026 Guide for Enterprise IT Teams
3. Enhanced system reliability and uptime
Observability doesn't just help you respond to problems faster. It fundamentally improves system reliability through real time insights that prevent recurring issues and inform better architectural decisions.
Pattern recognition: Through historical incident data analytics, observability platforms can identify patterns that lead to failures,such as specific configurations that create instability, dependencies that cause cascading issues, or usage patterns that trigger resource exhaustion.
Informed business decisions: Instead of over-provisioning infrastructure, organizations make data-driven decisions about capacity planning, scaling strategies, and architectural improvements based on actual usage patterns and performance data.
Continuous improvement: Post-incident analysis becomes automated rather than manual. Machine learning models learn from every incident, building organizational knowledge that improves over time even as personnel changes.
Measurable outcomes: Organizations with mature observability practices report 99.9%+ uptime for critical services, with some achieving 99.99% through predictive maintenance and proactive issue prevention.
4. Cost optimization and savings
By providing deep visibility into system performance and resource utilization, observability solutions enable organizations to identify inefficiencies, eliminate waste, and make smarter decisions about where to invest.
One of the key benefits is the ability to consolidate multiple tools into a unified observability platform. This not only reduces the direct costs associated with managing and maintaining disparate solutions but also streamlines workflows, leading to improved cost efficiency and faster incident resolution.
How does observability correlate technical metrics with business KPIs?
One of the most powerful capabilities of modern data observability platforms is connecting technical system performance directly to business outcomes. This correlation transforms observability from a mere tool into a strategic business asset that drives informed business decisions.
Traditional monitoring focuses purely on technical health, such as CPU usage, memory consumption, network latency. While important, these metrics don’t directly answer the questions business leaders care about: How is system performance affecting revenue? Which technical issues impact customer retention? Where should we invest to drive business growth?
Enterprise observability bridges this gap by correlating data from technical infrastructure with business operations metrics. Data lineage is crucial in this process, as it allows organizations to trace the origins, transformations, and consumption of data for accurate business KPI mapping.
Real-world correlation examples
Payment Processing: Transaction Success Rate → Revenue Impact
A major financial institution processing millions of daily transactions deployed IR Transact to correlate technical performance metrics with business KPIs. The data observability platform revealed that payment gateway response times exceeding 800 milliseconds correlated with a 12% increase in abandoned transactions during checkout.
Technical metrics monitored: API response times, database query performance, network latency, payment processor availability
Business KPIs impacted: Transaction success rate, revenue per customer session, customer abandonment rate, processing costs
Business decision driven: The organization prioritized infrastructure upgrades for payment gateway performance over other IT investments, resulting in $4.2 million additional annual revenue through reduced transaction abandonment...a clear ROI from correlating data across technical and business domains.
Unified Communications: Call Quality → Employee Productivity
An enterprise with 15,000 employees across global offices used IR Collaborate to analyze logs and correlate UC system performance with operational efficiency metrics. The observability data revealed that video call quality degradation (measured by packet loss and jitter) during peak hours correlated with 23% longer meeting durations and increased follow-up meetings.
Technical metrics monitored: Packet loss rates, jitter, bandwidth utilization, codec performance, call drop rates
Business KPIs impacted: Meeting effectiveness, employee productivity metrics, collaboration tool satisfaction scores, IT support ticket volume
Business decision driven: Data teams presented analytics showing that network infrastructure investment of $180,000 would recover approximately $2.1 million annually in productivity gains. This represents a business case impossible to make without correlating technical data patterns with business operations impact.
Technical metric → Business KPI Mapping
|
Technical Metric |
Business KPI |
Business Impact |
|---|---|---|
|
API response time |
Customer conversion rate |
Slow APIs increase cart abandonment, reducing revenue |
|
Database query performance |
Order processing capacity |
Query bottlenecks limit transaction volumes during peak periods |
|
Application error rates |
Customer satisfaction scores |
Errors directly correlate with support tickets and churn |
|
Network latency |
Employee productivity |
Poor UC performance extends meeting times and reduces efficiency |
|
System availability |
Revenue per hour |
Every minute of downtime has quantifiable revenue impact |
|
Data pipeline completion time |
Business reporting accuracy |
Late data delivery delays critical business decisions |
How correlation drives strategic advantage
Organizations that effectively correlate technical metrics with business outcomes gain several strategic advantages:
Cost optimization through data-driven prioritization: Instead of treating all performance issues equally, data teams can prioritize fixes based on business impact. A system slowdown affecting 5% of users might receive lower priority than one affecting your highest-revenue customer segment. Decisions made impossible by correlating data across technical and business dimensions.
Proactive resource allocation: By analyzing historical data patterns, organizations predict which technical improvements will deliver the greatest business growth impact. Machine learning models identify where infrastructure investments prevent revenue loss versus where they provide marginal operational efficiency gains.
Cross-functional alignment: When IT teams present observability data showing direct correlation between system performance and business outcomes, technology investments become easier to justify. CFOs understand "reducing payment processing latency by 200ms increases revenue by $3M annually" far better than "we need faster servers."
Informed business decisions at scale: Enterprise observability platforms that continuously monitor and analyze logs, metrics, and traces provide real time insights that inform daily business operations, from capacity planning to customer experience optimization to strategic technology roadmap decisions.
The competitive advantage comes not from collecting more data, but from better resource utilization of the data you have, connecting technical performance metrics with the business KPIs that actually drive organizational success.
Top observability tools for enterprise environments
Selecting the right data observability platform is crucial for enterprise success. The best observability tools provide deep visibility into complex systems while delivering actionable real time insights that data teams can act on immediately.
For organizations managing business-critical environments, specialized observability solutions outperform generic monitoring platforms. Managing data investments is all about understanding industry-specific data patterns, compliance requirements, and operational workflows.
IR Transact: Enterprise observability for payment systems
IR Transact delivers comprehensive data observability for complex, high-volume payment environments where even milliseconds of latency or a fraction of failed transactions can cost millions in revenue and regulatory penalties.
What it monitors: Card payments, real-time payments, high-value payments, and settlement systems across multiple payment processors and financial institutions.
Key capabilities:
- End-to-end transaction visibility: Track individual payment journeys across payment gateways, processors, acquiring banks, and settlement systems to quickly identify bottlenecks and data quality issues affecting transaction success rates
- Anomaly detection for payment patterns: Machine learning algorithms detect unusual patterns in transaction volumes, processing times, and failure rates that signal fraud, capacity issues, or data pipeline problems
- Regulatory compliance support: Automated data collection and retention meets PCI-DSS, SOX, and regional financial regulations, with audit trails that demonstrate proactive data reliability monitoring
- Multi-vendor integration: Unified observability platform across diverse payment technology stacks, eliminating data silos that create blind spots in transaction processing
Business impact: Financial institutions using IR Transact report faster root cause analysis for payment failures, reduced operational costs through better resource utilization, and improved regulatory compliance through comprehensive telemetry data collection.
IR Collaborate: Enterprise observability for unified communications
IR Collaborate provides experience management and deep visibility for complex, multi-vendor unified communications environments where call quality and collaboration reliability directly impact business operations and employee productivity.
What it monitors: Unified communications platforms, contact centers, service provider networks, and the infrastructure supporting real-time collaboration.
Key capabilities:
- Multi-vendor UC visibility: Single unified observability platform providing consistent data observability across disparate collaboration tools, eliminating multiple tools that create fragmented insights
- User experience analytics: Correlating data from network performance metrics, application behavior, and actual user experience to identify bottlenecks affecting collaboration quality
- Proactive capacity management: Machine learning models analyze usage data patterns to predict bandwidth saturation, licensing constraints, and infrastructure capacity needs before they impact business users
- Compliance and governance: Comprehensive log data collection supporting compliance requirements while enabling data teams to quickly analyze logs for security incidents or policy violations
Business impact: Organizations using IR Collaborate achieve enhanced operational efficiency through faster incident resolution, improved user satisfaction through proactive issue prevention, and better resource utilization through data-driven capacity planning.
Choosing the Right Observability Solution
|
Consideration |
IR Transact |
IR Collaborate |
|---|---|---|
|
Primary Focus |
Payment transaction systems |
Unified communications |
|
Key Strength |
Financial compliance + transaction visibility |
Multi-vendor UC integration |
|
Ideal For |
Banks, payment processors, financial institutions |
Enterprises with complex collaboration environments |
|
Data Sources |
Payment gateways, processors, settlement systems |
UC platforms, contact centers, networks |
|
600 million transactions manged daily |
50% faster incident resolution 49% decrease in outages 43% saving in operational costs |
The most effective observability strategy often combines specialized platforms for critical business systems with broader infrastructure monitoring, ensuring data quality and data consistency across your entire enterprise technology stack.
The role of AI in modern observability platforms
AI has transformed observability from a passive data collection tool into an active intelligence system that predicts, prevents, and often resolves issues autonomously.
AI-powered observability addresses challenges that overwhelm human operators—processing massive data volumes, identifying subtle anomalies across complex data pipelines, correlating events across distributed systems, and learning from historical data patterns to predict future behavior.
Read more about AI Observability: Complete Guide to Intelligent Monitoring (2025)
AI-Powered anomaly detection
Traditional monitoring relies on static thresholds that generate false positives during expected variations and miss subtle issues that fall within "acceptable" ranges. AI-powered anomaly detection takes a fundamentally different approach.
By understanding context and correlating data across systems, AI dramatically reduces false positives. Instead of hundreds of alerts requiring manual triage, data teams receive a prioritized list of genuine issues requiring attention.
Modern machine learning algorithms analyze telemetry data in real time, detecting anomalies within seconds of occurrence rather than waiting for issues to cascade into user-impacting failures.
Autonomous remediation
The ultimate expression of AI in observability is systems that don't just detect and diagnose problems but automatically resolve them before users experience impact.
How it works: AI systems learn from how data engineers and IT teams resolve incidents, building knowledge about which remediation actions work for specific problem types. Over time, the system gains confidence in handling incidents autonomously, at first suggesting actions for human approval, then taking action automatically with notification, and eventually handling routine issues without intervention.
Real-world applications:
- Payment systems: Detecting transaction processor degradation and automatically routing traffic to backup processors while the primary gateway recovers
- Unified communications: Identifying bandwidth saturation and dynamically adjusting quality-of-service policies to maintain call quality
- Data pipelines: Detecting pipeline failures and automatically triggering retry logic or alerting data teams with full context for manual intervention
The business impact is substantial. Faster incident resolution, reduced Mean Time to Repair (MTTR), and freed engineering capacity for strategic work rather than reactive firefighting.
How to choose the right observability platform
Selecting an observability solution requires evaluating both technical capabilities and strategic fit:
Industry specialization: Generic observability tools provide broad coverage but may lack depth for business-critical systems. Organizations managing payment infrastructure or unified communications benefit from specialized platforms like IR Transact or IR Collaborate that understand industry-specific data quality requirements and compliance needs.
Integration with existing systems: The platform must work with your current technology stack, including cloud providers, on-premises infrastructure, SaaS applications, and legacy systems. Evaluate how easily the platform ingests data from your specific environment.
Scalability and performance: As data volumes grow, your observability platform must scale without degraded performance or exponentially increasing costs.
AI and automation capabilities: Assess the platform's machine learning maturity; does it provide genuine intelligent anomaly detection and root cause analysis, or just basic rule-based alerting? Can it learn from your specific environment, or does it rely solely on generic models?
Compliance and governance: For regulated industries, ensure the platform supports data retention requirements, audit trails, role-based access controls, and regional data sovereignty needs.
Vendor expertise and support: Observability implementation involves both technology deployment and organizational change. Evaluate vendor professional services, training programs, and ongoing support—particularly important for specialized platforms supporting business-critical environments.
Regulatory compliance and governance
In today’s complex regulatory landscape, observability data serves as a critical resource for audit trails, enabling organizations to quickly identify and respond to data incidents, mitigate risks, and document compliance efforts. This is especially important in multi-cloud environments, where data silos can complicate oversight and increase the risk of non-compliance.
Integrating observability with governance frameworks ensures that data operations are aligned with both business objectives and regulatory mandates.
By leveraging observability solutions to maintain deep visibility and control over data systems, organizations can navigate complex regulatory requirements, manage data silos, and ensure that their operations remain secure, compliant, and ready for future growth.
Frequently Asked Questions
Q: What is the difference between monitoring and observability?
A: Monitoring is reactive: It tells you when something breaks by tracking predefined metrics against static thresholds. Observability is proactive: It tells you why it broke by providing the ability to ask arbitrary questions about system behavior through unified analysis of metrics, logs, and traces.
Q: How does observability improve system performance?
A: Observability platforms use machine learning algorithms to identify performance bottlenecks that traditional monitoring misses by correlating data across systems, analyzing historical data patterns, and revealing dependencies between components.
Q: What are the key metrics in observability?
A: The three pillars of observability: metrics, logs, and traces, provide complementary insights. Metrics show what's happening (CPU usage, transaction volumes, response times). Logs provide detailed event records for troubleshooting. Traces reveal how requests flow through distributed systems.
Q: How can observability impact business KPIs?
A: Enterprise observability directly impacts business outcomes by correlating technical system performance with business operations metrics. For example, reducing payment processing latency improves transaction success rates and revenue. Improving unified communications quality increases employee productivity and collaboration effectiveness.
Q: What industries benefit most from enterprise observability?
A: All industries managing complex technology environments benefit from observability, but it's particularly critical for organizations where system performance directly impacts revenue and customer experience. Financial institutions, healthcare organizations, telecom providers educational institutions with distributed systems, multiple tools, and zero tolerance for downtime gains strategic advantage through comprehensive observability.
Discover IR Enterprise Observability Solutions
IR Transact provides comprehensive data observability for high-volume payment environments, ensuring transaction reliability, regulatory compliance, and optimal resource utilization across card payments, real-time payments, and settlement systems.
IR Collaborate delivers experience management and deep visibility for multi-vendor unified communications environments, enabling proactive issue prevention, faster root cause analysis, and improved collaboration quality across multiple communications platforms and contact center platforms.
Meet Iris - Your all-in-one solution to AI-powered observability


