


.png?width=141&height=141&name=Transact%20(1).png)






.svg)

.svg)
.svg)
.svg)


%201.svg)















Quick answer
Evaluating an enterprise monitoring platform comes down to one question: can it correlate performance across every domain, vendor, and system your business depends on, not just collect data from each one separately? A checklist built around features tells you what a vendor’s dashboard shows. A checklist built around correlation, multi-vendor coverage, and business-critical visibility tells you whether the platform can find a root cause before your customers do.
Key takeaways
- The dividing line that matters is monitoring versus observability, not one vendor against another.
- Point monitoring tools remain useful for narrow, well-understood problems. They were not built for cross-domain correlation.
- A genuine evaluation runs on defined criteria, not a feature list copied from a vendor’s data sheet.
- Ecosystem intelligence extends observability by connecting technical signals to business outcomes across a multi-vendor environment.
- A unified platform earns its place when the cost of not correlating across systems outweighs the cost of consolidating them.
What’s the difference between monitoring and observability?
Monitoring answers one question: is everything working as expected? Observability answers a harder one: why isn’t it, and what else does that affect?
Traditional monitoring watches predefined metrics against thresholds and tells you when one is breached. That is useful, but it is reactive. It can flag problems it already knows to look for. Observability works from raw telemetry, including metrics, logs, and traces, so a team can ask questions it did not anticipate needing to ask and trace a problem across systems rather than within one.
For a business-critical environment, such as a payments platform processing millions of transactions or a contact center handling live customer calls, that distinction is operational. Monitoring tells you a call dropped. Observability helps you investigate why it dropped, which other calls on the same route are at risk, and whether the root cause sits in the network, the carrier, or the endpoint.
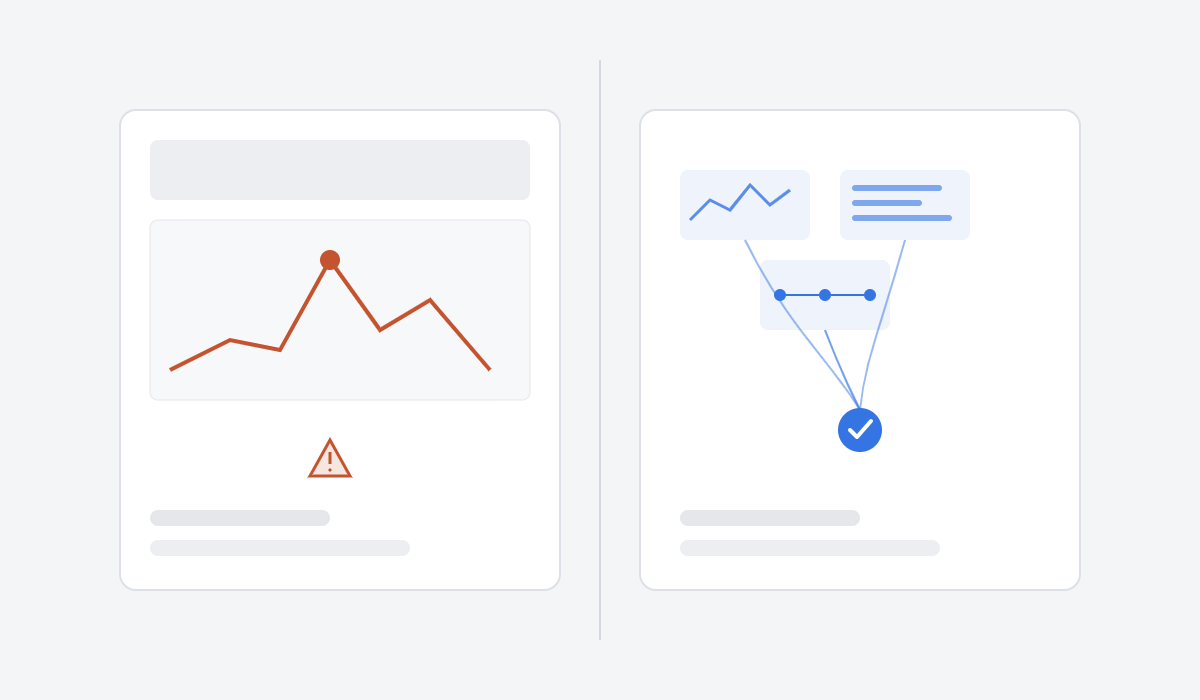
This is why “we already have monitoring” and “we have observability” are not the same claim. An organization can have dozens of monitoring alerts firing correctly and still lack observability because those alerts are not correlated into one explanation of what is happening across systems.
Why a feature checklist alone will not tell you which platform is right
Search for how to evaluate a monitoring platform and much of what you find will be a vendor’s own buying guide. That is not necessarily wrong, but it is not neutral either. A log-analytics vendor may weight log ingestion volume heavily. An APM vendor may weight code-level tracing. Each is grading the market against its own strengths.
A useful evaluation checklist works the other way around: start from what your environment needs to see, then test every vendor, including unified platforms, against those requirements. If two shortlisted vendors both claim comprehensive monitoring, the checklist that matters is the one that tells you which can trace a degraded customer call across a session border controller, a carrier link, and an endpoint, not which has more dashboard widgets.
This matters more as your environment becomes more specific. A regional bank running real-time payments has a different failure profile from a telecom service provider operating a multi-vendor contact center, even though both may search for an enterprise monitoring platform checklist. The criteria in this guide are environment-agnostic. How you weight each one should not be.
How to structure the evaluation itself
Before scoring any vendor, do four things:
- Map your environment across domains and vendors. List every system a business-critical process touches, including UC platforms, contact centers, payment gateways, networks, and infrastructure, along with every vendor behind each one. This becomes the test bed for every criterion.
- Identify your two or three most recurring failure patterns. Use incidents from the last 12 months and record how long each took to trace to a root cause. This tells you which criteria to weight most heavily.
- Score each vendor against your environment, not a demo environment. A proof of concept against a representative slice of your real infrastructure, including your actual vendor mix, surfaces gaps a sales demonstration will not.
- Model total cost at your actual data volume. Consumption-based pricing behaves differently at enterprise telemetry volumes than it does in a pilot.
This sequence takes weeks, not days, for most enterprise evaluations. It is the difference between choosing a platform that works in a demo and one that works in your environment.
Point monitoring tools versus a unified platform: how to tell which you need
IR’s comparison of observability tools across SMB and enterprise tiers explores this decision in more depth. The right answer scales with the size and complexity of the environment, not with what is currently fashionable.
Point tools remain useful for narrow, well-defined problems. A dedicated network analyzer can be the fastest way to diagnose a specific link issue. A single-application performance tool can be the right choice when one team owns one application end to end and does not need visibility into upstream or downstream systems.
Where point tools run out of road is correlation. If business-critical services depend on multiple vendors and domains, a fault rarely stays inside one boundary. A degraded call may trace back to a misconfigured session border controller, a saturated network link, or a carrier issue. A point tool scoped to one layer can only rule that layer in or out. Someone still has to stitch the story together across dashboards.
A unified platform is the right call when that manual stitching is already costing your team time, or when a failure in one domain has a record of affecting outcomes in another. It is the wrong call if your environment is genuinely single-domain and single-vendor. Consolidating tools to solve a correlation problem you do not have adds cost and migration risk.

The core evaluation criteria for an enterprise monitoring platform
Run every vendor on your shortlist, whether it is a point tool or a unified platform, against the same eight criteria. This is the part a vendor-authored checklist cannot give you objectively.
| Criterion | What to check | Why it matters |
|---|---|---|
| Multi-domain coverage | Does it correlate across UC, contact center, payments, and infrastructure, or only within one? | A fault that crosses domains needs a platform that can see across them. |
| Multi-vendor support | Does it work across your actual vendor mix, such as Teams, Zoom, Cisco, or Avaya, rather than only its own ecosystem? | Most enterprises run hybrid, multi-vendor environments by necessity. |
| Business-critical and transaction-level visibility | Can it trace an individual transaction or call, not just aggregate system health? | Aggregate dashboards can look healthy while individual customer experiences fail. |
| Root-cause correlation speed | Does it automate correlation across metrics, logs, and traces, or leave an engineer to cross-reference manually? | Manual correlation slows mean time to repair. |
| Deployment flexibility | Does it support your mix of cloud, on-premises, and hybrid systems? | A platform that only covers cloud-native workloads leaves hybrid infrastructure blind. See IR’s proactive IT infrastructure monitoring guide. |
| AI-assisted analysis | Does it use AI to reduce alert noise and surface probable causes, or simply add another dashboard? | The value is in fewer, higher-confidence alerts, not more data to review. |
| Data residency and compliance | Can it meet your region’s data sovereignty, retention, and audit requirements? | This is non-negotiable for regulated industries and multi-region enterprises. |
| Licensing and total cost of ownership | Is pricing predictable at your data volume and vendor count, or does it scale unpredictably with usage? | Consumption-based pricing can offset, or erase, the savings from tool consolidation. |
Use this as a genuine scoring exercise against your environment, not a box-ticking pass. A platform that scores well on multi-domain coverage but poorly against a specific compliance requirement is not the right fit yet, regardless of how it performs elsewhere.
Weight the criteria differently depending on your environment. A multi-site retailer running card payments across regions may weight data residency and licensing heavily. A contact center operator running a hybrid Teams and Cisco environment may weight multi-vendor support and root-cause correlation speed more heavily. Large healthcare organizations may place compliance and deployment flexibility above the rest because much of their infrastructure remains on-premises. There is no universal ranking, only the ranking that matches what breaks in your environment.
Ecosystem intelligence versus IT monitoring at enterprise scale
IT monitoring stops at infrastructure health: is the server up, is the network link within tolerance, and is the application responding? That is necessary, but it does not tell you what a degraded metric means for the business.
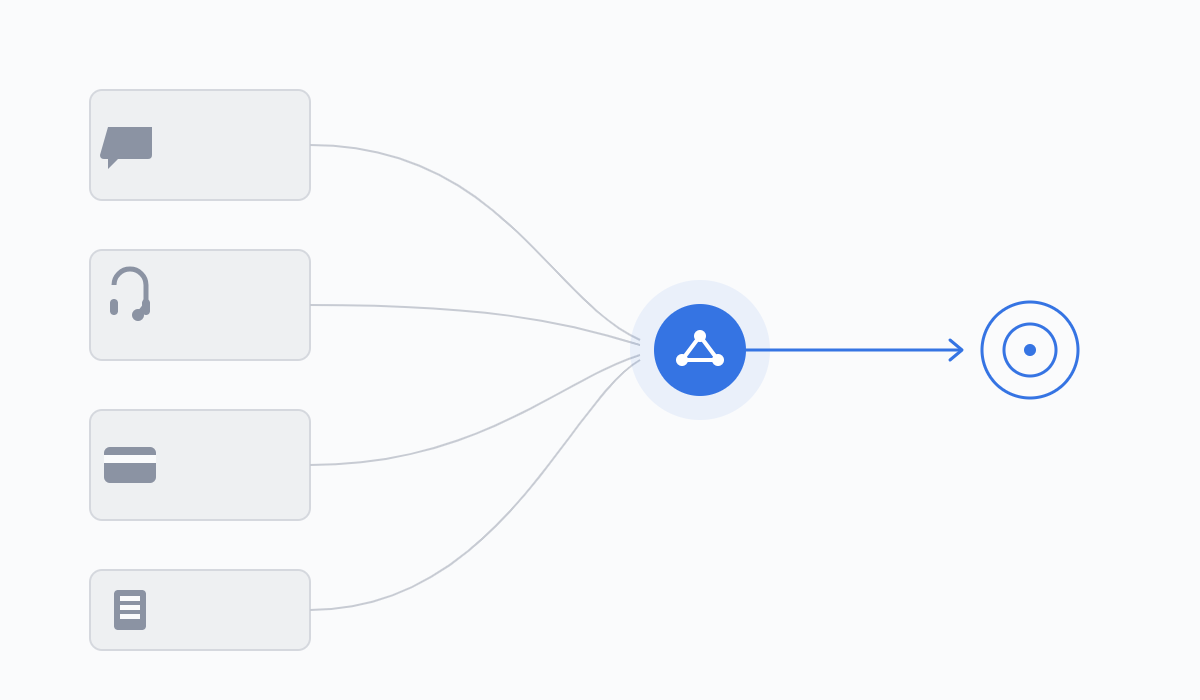
Ecosystem intelligence extends observability one layer further. It correlates technical performance across a multi-vendor environment and ties it to the outcome that matters: a completed transaction, a resolved customer call, or an uninterrupted meeting. At enterprise scale, this matters because the systems generating the most telemetry, including UC platforms, contact centers, and payment gateways, are also where a technical fault can translate directly into a customer-facing or revenue-facing failure.
IR’s guide on building an enterprise observability strategy covers this progression in more depth. A platform-level view earns its place not simply by seeing more data, but by connecting data that was never in the same place before.

What this looks like for MSPs
Managed service providers face this problem across every client environment they support. An MSP monitoring UC and infrastructure for multiple clients needs multi-domain correlation within each environment and multi-tenant visibility across all of them, without one client’s telemetry volume degrading visibility into another’s.
When evaluating for an MSP context, add tenant isolation and per-client reporting to the criteria above, and weight deployment flexibility heavily. Client environments rarely standardize on the same vendor mix.
Where point tools and single-domain platforms fall short at scale
Log-analytics-first platforms and single-domain point tools remain strong at what they were built for, including security investigation, log search, or diagnostics within one system. They were not architected to correlate in real time across voice, payments, and infrastructure simultaneously because that was not the problem they were solving.
That is a scoping mismatch, not a criticism of the tools. It appears specifically at enterprise scale, in multi-vendor, business-critical environments, which is the environment this checklist assumes you are evaluating for.
Common mistakes to avoid during the evaluation
- Scoring against a demo instead of your environment. Insist on a proof of concept against a representative, messy slice of your actual infrastructure and vendor mix.
- Letting the vendor set the criteria. Treat every category on a vendor-supplied scorecard as a hypothesis to verify.
- Under-weighting total cost of ownership at scale. Model consumption-based pricing at real data volume before signing.
- Treating migration effort as a rounding error. Consolidating tools is a change management project, not a switch flip.
- Skipping the failure-pattern review. Review what actually broke in the last 12 months and how long each incident took to trace.
How IR Prognosis meets these criteria
The IR Prognosis platform is built around multi-domain, multi-vendor correlation rather than single-domain monitoring. IR Collaborate applies that approach to unified communications and contact center environments, giving teams visibility across Teams, Zoom, Cisco, and other UC platforms in a single view. IR Transact applies the platform to high-volume payments, correlating performance across card, real-time, and settlement systems. IR Infrastructure extends the approach to mission-critical HPE NonStop environments.
Iris, the AI layer built into IR Prognosis, is designed to reduce the manual correlation work described above by surfacing probable root causes across metrics, logs, and traces rather than requiring an engineer to reconcile them by hand. IR’s guide to AI observability tools covers what to look for in AI-assisted analysis.
An independent buyer’s guide evaluation of IR’s observability solutions provides an additional perspective for teams that want a third-party view before relying on a vendor’s description.
| Criterion | Where IR Prognosis is built for it |
|---|---|
| Multi-domain coverage | One platform underlies Collaborate, Transact, and Infrastructure rather than separate tools per domain. |
| Multi-vendor support | Designed for hybrid, multi-vendor UC and infrastructure environments. |
| Business-critical and transaction-level visibility | Traces individual calls and transactions, not only aggregate system health. |
| AI-assisted analysis | Iris surfaces probable root causes across metrics, logs, and traces. |
None of this replaces the evaluation exercise. It is a reason to run IR Prognosis through the same eight criteria as every other option, not a reason to skip the exercise.
Frequently asked questions
What’s the difference between monitoring and observability?
Monitoring tells you when a predefined metric crosses a threshold. Observability lets you query raw telemetry, including metrics, logs, and traces, to understand why something happened and investigate problems you did not know to look for in advance.
How long should an enterprise monitoring platform evaluation take?
Long enough to test each vendor against your own environment, not a demo environment. Most enterprise evaluations run a proof of concept against a representative slice of the environment before committing, which typically takes several weeks rather than days.
Should we build our own monitoring stack or buy a platform?
Building in-house can work for a single, well-understood domain. It becomes expensive to maintain once you need correlation across multiple vendors and domains because that correlation logic has to be built and maintained indefinitely.
What’s different about evaluating a platform as an MSP versus an enterprise IT team?
An MSP typically needs multi-tenant support and the ability to stand up monitoring quickly across many different client environments, in addition to the eight criteria above. An enterprise IT team is usually evaluating one environment it already knows in depth.
How much effort does migrating from point tools to a unified platform take?
It depends on how many tools are being consolidated and how much correlation logic currently lives in runbooks or in people’s knowledge. A phased migration, running the new platform alongside existing tools before retiring them, reduces the risk of a coverage gap. Most enterprise migrations run in stages over one to two quarters rather than as a single cutover.
Is a unified platform ever the wrong choice?
Yes. If your environment is genuinely single-domain and single-vendor, a unified platform adds cost and migration effort to solve a correlation problem you do not have.
What is ecosystem intelligence?
It is the extension of observability across an entire multi-vendor environment, correlating technical performance with business outcomes such as a completed transaction or an uninterrupted call rather than stopping at infrastructure health.
Does a unified platform replace domain-specific point tools entirely?
Not always. Some point tools remain the fastest way to diagnose a narrow, well-understood problem. The question is whether your organization’s failures typically stay inside one tool’s boundary or routinely cross it.
Conclusion
The real cost of getting this evaluation wrong is not a dashboard you do not like. It is finding out about a failure from a customer instead of from your monitoring platform, after it has crossed a boundary your tooling could not see across.
Evaluate for correlation across your actual environment, not for the longest feature list, and the right platform for your organization becomes easier to identify.
See how the IR Prognosis platform correlates performance across a multi-vendor environment by requesting a demo. If you are still working through the shift from monitoring to observability, start with IR’s Monitoring to Observability guide.