


.png?width=141&height=141&name=Transact%20(1).png)






.svg)

.svg)
.svg)
.svg)


%201.svg)















Quick Answer: What is AI observability?AI observability is the continuous collection and analysis of logs, metrics, and traces from AI systems, including AI models and agents, and the data feeding them. AI observability reveals the internal state, performance, and behavior of systems in real time. AI observability tools turn collected telemetry into drift detection, bias alerts, and root-cause diagnostics, so teams can catch model degradation before it reaches customers, regulators, or the balance sheet. |
Why AI observability matters for enterprise AI
The black box problem
AI applications now sit inside decisions that used to be made by people. This includes credit approvals, fraud flags, customer recommendations, network capacity forecasts, contact center routing.
For many organizations, this AI infrastructure has become a web of sophisticated, interconnected systems, deployed and left to run as black boxes. Everyone has access to what goes in and what comes out, but almost nobody can see what happens in between because these systems run continuously, and largely out of sight. Traditional application performance monitoring (APM) tells you whether those systems are up, fast, and error-free. It says nothing about whether the model behind them is still making good decisions.
That gap is where AI observability lives. For example, performance metrics can look healthy, with normal latency, no error spikes, dashboards all green, but the model's actual decision-making could be quietly deteriorating underneath.
-
Data drift creeps in as real-world inputs diverge from training data.
-
Bias creeps in as outputs start favoring or penalizing certain groups.
-
Hallucinations creep into generative outputs that read as confident and are simply wrong.
None of this trips a conventional alert, because none of it is a conventional failure.
Where the risk lands
The stakes scale with the industry.
-
In healthcare, clinicians and administrators lean on AI-assisted decisions that may not be independently verifiable in the moment.
-
In financial services, undetected model degradation can misprice risk or approve the wrong loans at scale before anyone notices.
-
In telecommunications and payments, a silently degrading AI agent embedded in a contact center or a fraud-detection pipeline can erode customer trust long before it shows up on a traditional monitoring dashboard.
The business case
Gartner projects that by 2028, 60% of software engineering teams will adopt AI evaluation and observability platforms. This is a significant reflection of how quickly nondeterminism in generative AI and agentic systems has become a board-level risk rather than an engineering footnote.
“AI applications and agents are inherently nondeterministic and opaque. This makes it difficult to measure and improve their reliability, accuracy and trust using traditional testing and observability methods and tools. By 2028, 60% of software engineering teams will adopt AI evaluation and observability platforms, up from just 18% in 2025"
Source: Gartner Market Guide for AI Evaluation and Observability Platforms, published February 2, 2026: Via Comet
Forrester Consulting's "Total Economic Impact" study shows that a composite enterprise using Monte Carlo's data and AI observability platform achieved a 357% ROI and recovered costs in under six months, as per the Monte Carlo JetBlue case study.
|
357% Forrester-measured 3-year ROI on AI observability implementation |
<6 mo. Payback period on that investment, per the same analysis |
+16 pts JetBlue's NPS increase within a year of adopting observability practices |
AI observability tools observe AI behavior, closing the gap between what an AI system is perceived to be doing and what it's actually doing. This givesteams real-time visibility from data quality through to model output, instead of finding out about a problem from a customer complaint or a regulator's inquiry.
There's a cost dimension too, separate from risk. AI workloads are expensive to run, and token usage scales directly with adoption. So the more an AI application is used, the more it costs, unless someone is watching. Without observability data on model latency, token consumption, and provider spend, cost optimization becomes guesswork: teams either over-provision to be safe, or discover a runaway cost anomaly after the invoice arrives rather than while it's happening.
The same telemetry that catches a quality regression is usually the telemetry that catches a cost regression, which is one reason AI observability tools increasingly sit next to, rather than separate from, financial operations reporting.
Find out more about Observability Signals
Types of AI observability tools
The AI observability tools market has consolidated around a handful of distinct approaches, each suited to different teams, budgets, and risk profiles. Rather than a single category, it's more useful to think of it as six overlapping bands.
1. Agent and LLM observability platforms
These are purpose-built for tracing generative AI and AI agents rather than adapted from general-purpose APM.
LLM observability tools such as LangSmith (from the LangChain team), allows subject matter experts to annotate traces without engineering skills. Arize Phoenix and Arize AX, Langfuse, Braintrust, and Comet's Opik capture the complete execution tree of an LLM call or agent run, including prompts, retrieval steps, tool invocations, intermediate reasoning, and the final output. They then connect that trace data to evaluation workflows. Confident AI, an enterprise AI evaluation and observability platform, evaluates every trace with 50+ research-backed metrics.
These types of tools are best for teams building LLM-powered products or autonomous agents that need agent debugging and deep evaluation workflows, not just uptime.
2. APM-extended / infrastructure-native observability
Datadog's LLM Observability module and Dynatrace's AI observability capabilities extend an existing APM platform to also capture generative AI spans, correlating LLM performance with the infrastructure metrics such as CPU, GPU, network underneath it.
This suits organizations that already run infrastructure monitoring on one of these platforms and want LLM and infrastructure metrics unified in a single pane rather than stitched together from separate tools. Datadog and New Relic provide basic AI telemetry without evaluation metrics.
3. Open-source and self-hosted platforms
Langfuse and Arize Phoenix both offer fully open-source, self-hostable cores. Arize AI offers real-time dashboards for agent workflows. Phoenix runs locally with zero external dependencies via a single function call; Langfuse's self-hosted stack is free with no usage limits, alongside a hosted cloud tier.
These lightweight observability platform options matter most for teams with data-residency requirements or those wary of sending proprietary prompts and outputs to a third party. The trade-off is usually engineering effort: self-hosting requires more setup than a managed SaaS tool, and some evaluation features require enterprise licensing even in paid cloud tiers.
4. Enterprise AI evaluation and governance platforms
Confident AI, Fiddler AI, Openlayer, and Microsoft Foundry lean toward governance: standardizing how different product teams evaluate, monitor, and secure AI applications across models and frameworks, often for regulated industries.
These platforms typically add advanced governance features such as audit trails, access controls, bias and fairness reporting, that go beyond what a developer-first tracing tool offers out of the box. Gartner's Market Guide for AI Evaluation and Observability Platforms tracks this category specifically, citing nondeterminism in GenAI and agentic applications as the driver behind enterprise adoption.
5. Lightweight proxy and gateway observability
In a narrower category, tools like Helicone and Traceloop's OpenLLMetry sit in front of LLM API calls as a proxy or OpenTelemetry-based layer. Lunary, for example is a lightweight observability platform focused on RAG pipelines and chatbots. Helicone supports over 300 models for observability. Portkey and Helicone focus on routing and failover for LLM applications.
These tools track token usage, cost, latency, and request parameters with minimal setup. These tend to require less engineering effort to stand up than a full tracing platform, but they're not the primary focus for teams that need deep evaluation workflows or agent-level reasoning traces; they're best paired with a dedicated evaluation tool rather than used as the only layer of observability.
6. Enterprise-embedded observability
A smaller category including IR's own Iris capability, built into the Prognosis platform, embeds AI observability directly inside the broader systems it monitors, rather than bolting it onto a single application.
For enterprises running AI features inside unified communications, contact center, or payments infrastructure, this means AI performance is monitored in the same place as the infrastructure metrics, call quality, and transaction data it depends on, rather than in a separate developer tool disconnected from the business systems it sits inside of.
At a glance:
|
Category |
Example Platforms |
Best For |
|
LLM & Agent Observability |
LangSmith, Arize Phoenix, Langfuse, Braintrust, Comet Opik |
Teams building LLM apps/agents needing deep tracing & evals |
|
APM-Extended |
Datadog LLM Observability, Dynatrace |
Unifying LLM and infrastructure metrics in one platform |
|
Open-Source / Self-Hosted |
Langfuse, Arize Phoenix |
Data-residency needs or budget-constrained engineering teams |
|
Enterprise Evaluation & Governance |
Confident AI, Fiddler AI, Openlayer, Microsoft Foundry |
Regulated industries standardizing evals across teams |
|
Lightweight Proxy / Gateway |
Helicone, Traceloop, Lunary (OpenLLMetry) |
Fast, low-effort cost and latency tracking |
|
Enterprise-Embedded |
IR Iris (on Prognosis) |
Enterprises monitoring AI inside UC/payments infrastructure |
Note: Platform capabilities and pricing change quickly in this market; confirm current features directly with each vendor before making a purchasing decision.
Need an in-depth observability tools comparison?
Read our guide: Top Observability Tools Comparison 2026: SMBs vs Enterprise Platforms
The Core Components of AI Observability
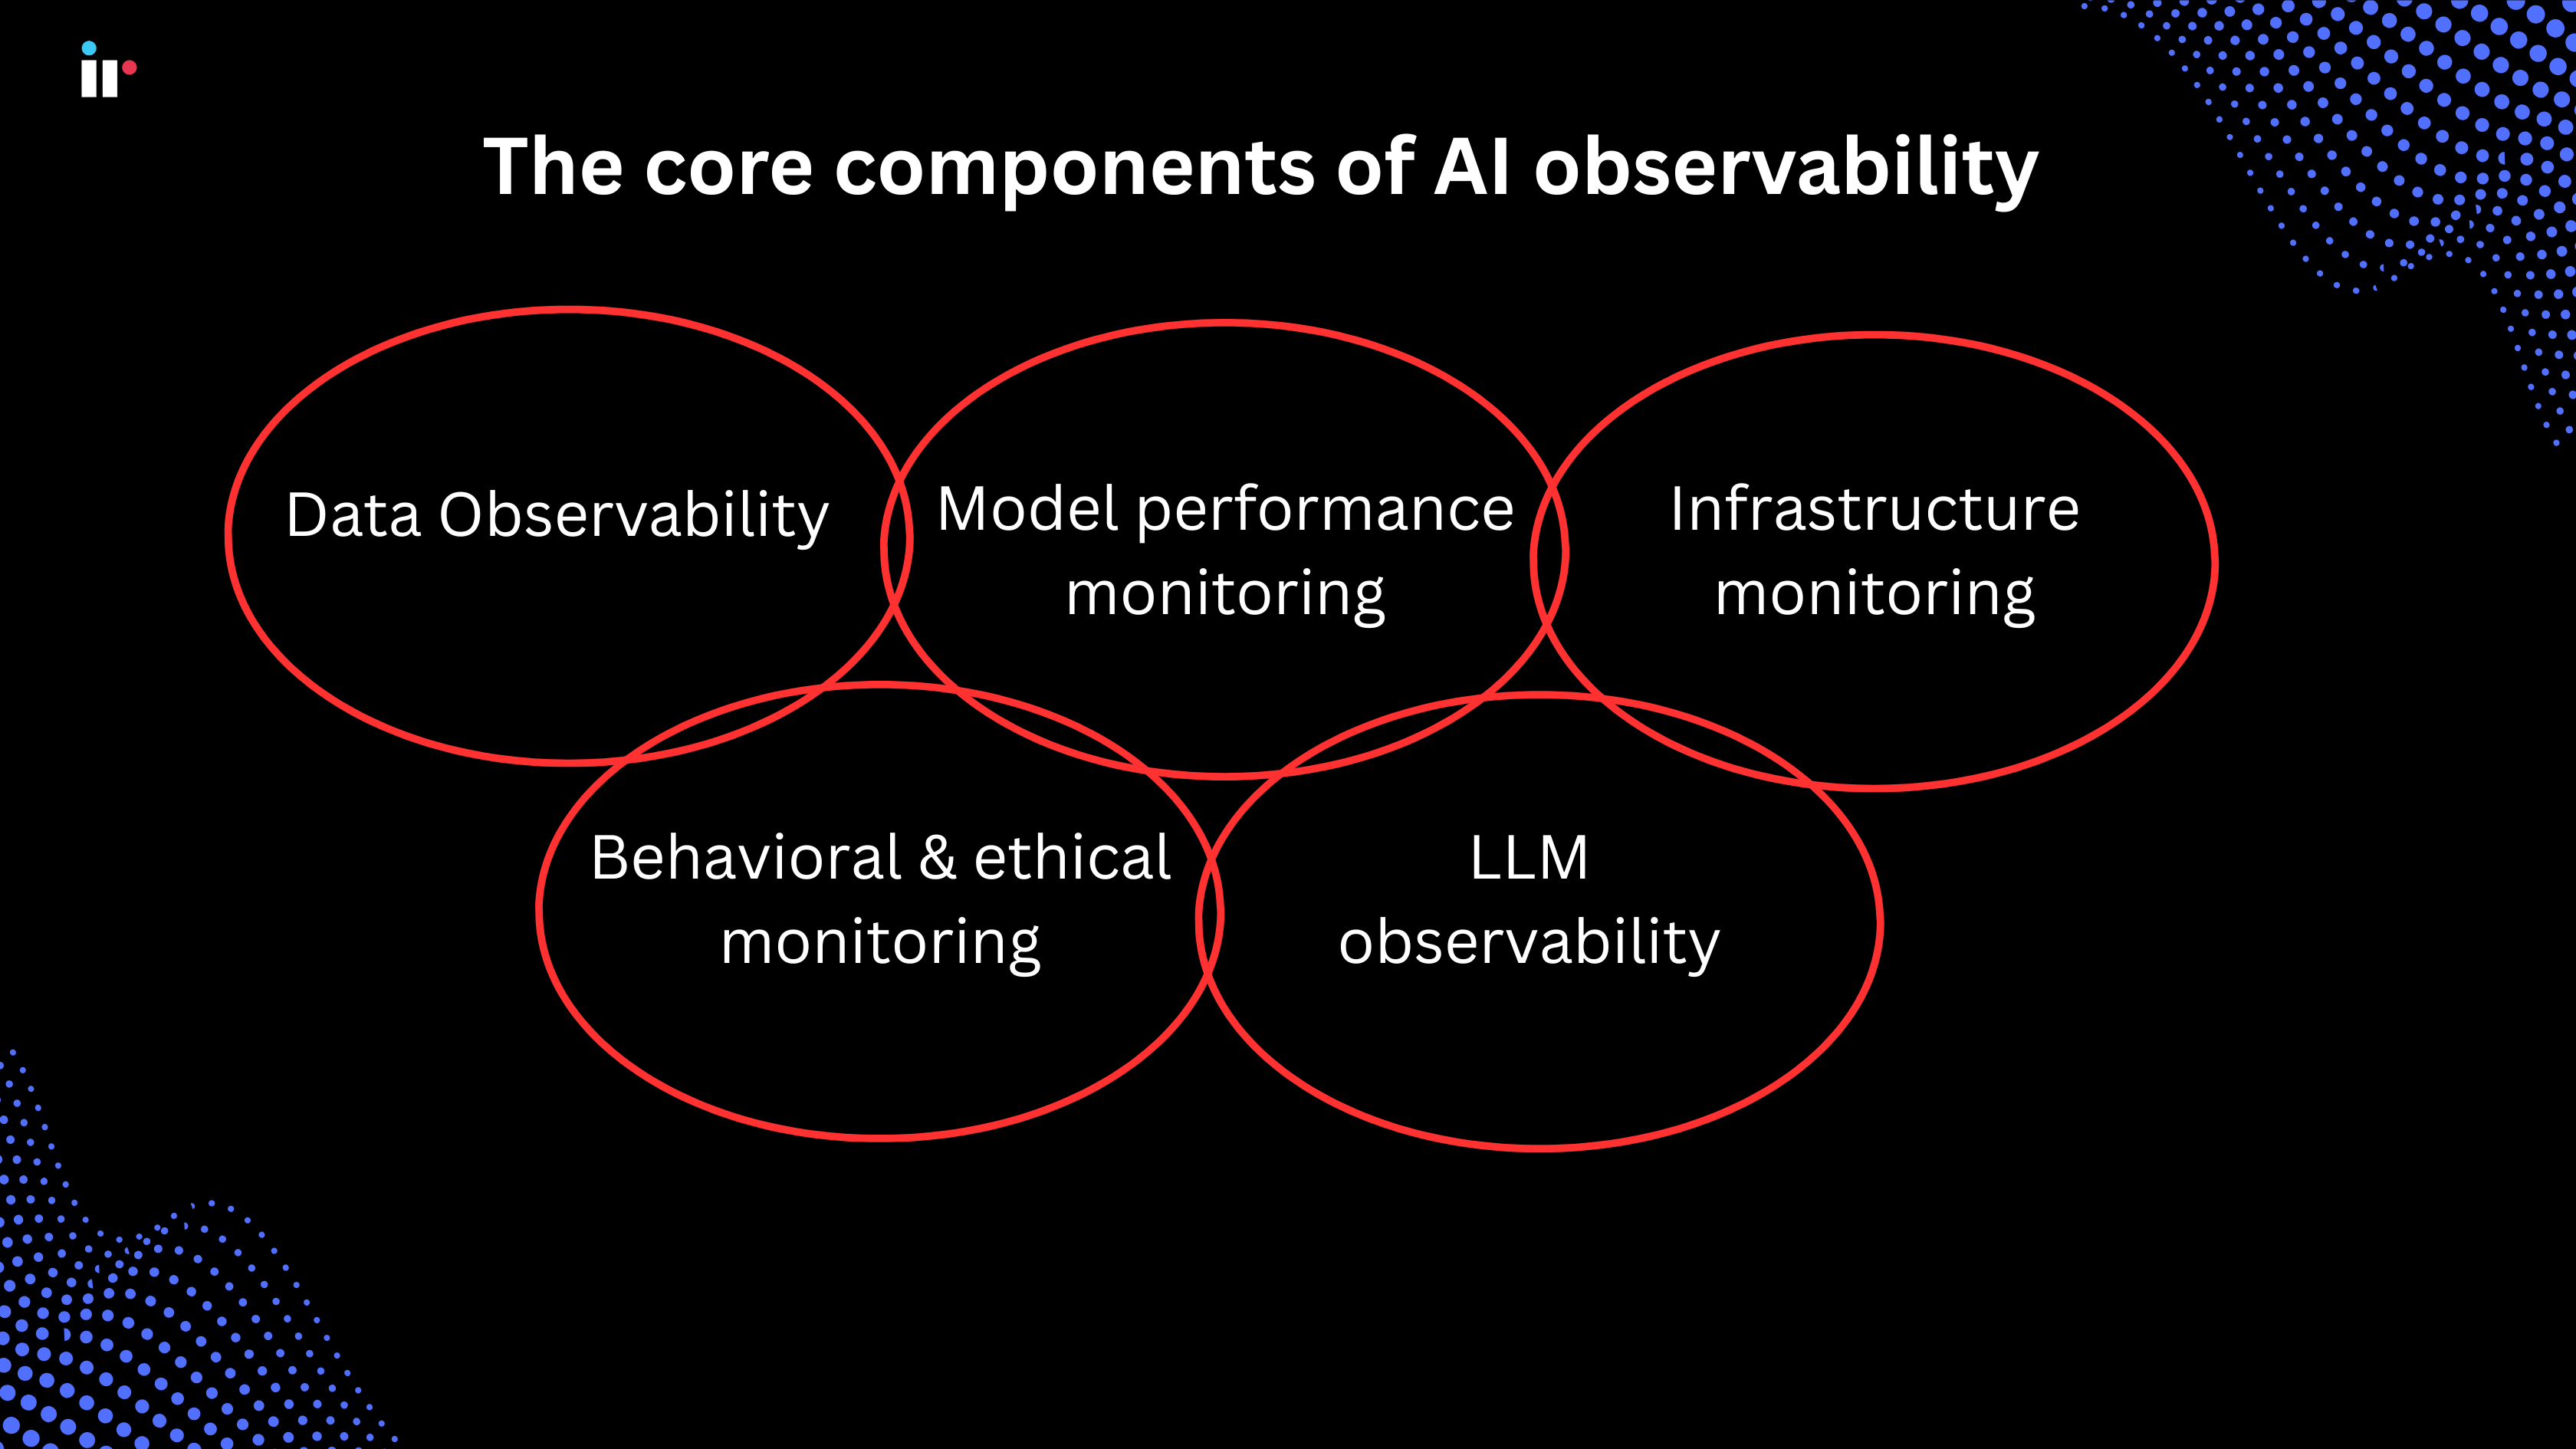
Whichever platform a team chooses, effective AI observability tools cover four consistent layers, plus a specialized fifth for language models, but these layers aren't independent silos.
A drifting input distribution in data observability often shows up a few weeks later as a model performance problem, and a model performance problem in a customer-facing agent often shows up as a behavioral or ethical monitoring flag.
The value of treating them as one connected system, rather than four separate dashboards, is catching that chain early instead of at the end of it.
Data observability
-
Tracking structured and unstructured inputs like prompts, context, documents, training data, to catch schema violations and anomalies before they reach the model.
-
Evaluating generated outputs for hallucinations, bias, and toxicity: output-quality checks that sit close to the model boundary.
-
Watching for drift, or changes in model behavior and predictions over time that signal training data no longer matches production reality.
Model performance monitoring
-
Semantic and technical metrics side by side: accuracy alongside deeper analysis that catches outputs which are plausible but wrong, a failure mode static accuracy metrics miss entirely.
-
Bias and fairness auditing across both the training data and the model's own objectives.
Infrastructure monitoring
-
Resource utilization, tracking CPU, GPU, and other compute consumption, since AI workloads are typically far more resource-intensive than the applications around them.
-
System-level metrics like model latency, throughput, and token usage, to manage both performance and the token costs that scale directly with usage.
Behavioral and ethical monitoring
-
Analyzing how a model responds to varied and adversarial inputs to catch unexpected behaviors early.
-
Monitoring ethical guardrails, flagging oversharing of sensitive data, and checking ongoing compliance with fairness standards.
LLM observability: the specialized layer
LLM observability sits inside the broader AI observability category, focused specifically on large language models and the agents built on top of them: how they reason, which tools they call, what outputs they generate, and how those outputs perform against evaluation datasets.
AI observability covers every type of AI infrastructure, from classic ML models to LLMs; LLM observability narrows in on the reasoning traces, tool calls, and context relevance issues unique to generative and agentic systems.
How to evaluate AI observability tools
Once a team has a shortlist, the practical decision usually comes down to seven questions. None of them has a universal right answer as to the best observability tools. A five-person startup building a single chatbot will land on different tools than a regulated bank running dozens of AI-assisted workflows, even when they're evaluating the same shortlist.
1. Framework and provider coverage
Does the platform support multiple frameworks (LangChain, LangGraph, LlamaIndex, the Vercel AI SDK) and multi-provider management across the LLM providers already in use, or does it lock a team into one ecosystem? LangSmith offers the deepest integration with LangChain and LangGraph specifically; framework-agnostic tools like Langfuse and Phoenix trade some of that polish for portability.
2. Trace and agent depth
For any system built on AI agents, look for a complete execution tree that includes every tool invocation, intermediate reasoning step, and tool call, not just a call-level record of the final prompt and response. Multi-step agent failures are often invisible at the call level and only surface when the full session is traced.
3. Evaluation workflows
Strong platforms combine automated LLM-as-judge scoring, evaluation datasets, and human annotation workflows, and support both offline testing and online evaluations in production. This is what turns observability data into evaluation, and evaluation into engineering improvements, rather than a dashboard that nobody can act on.
4. Deployment model and latency overhead
Some platforms support agentless deployment and asynchronous data collection with negligible latency overhead; others require deeper SDK instrumentation and custom LLM management code, which can mean significant engineering effort before the first trace appears. Zero external dependencies matters for teams that want to test locally before sending any data to a vendor.
5. Cost model
Vendors price by span, trace, event, seat, or token usage, so the fairest comparison is a representative production workload, not a published starting price. Cost optimization features, such as sampling, deduplication, or prompt-caching alerts, can materially change the total bill at scale.
6. Governance and compliance
For regulated industries, confirm whether advanced governance features such as audit trails, redaction, access control, retention policies are included, or whether they require enterprise licensing. This is frequently where free and enterprise-ready tiers diverge sharply.
7. Integration effort vs. existing stack
If the organization already monitors infrastructure metrics elsewhere, weigh whether a new point tool adds unified observability or just another dashboard. Platforms that correlate LLM spans with existing APM and infrastructure data reduce the number of places an incident responder has to look.
A useful discipline once the shortlist is down to two or three platforms: run the same production-representative workload through each one for a week rather than relying on a vendor demo. Trace depth, evaluation quality, and pricing all look different under real traffic than they do in a sales walkthrough.
How to implement AI observability in your organization
Research published by IBM, notes that 45% of executives cite a lack of visibility into AI decision-making as a major barrier to scaling operations and establishing trust.
Implementing AI observability is not a click-and-go process. Many organizations have existing monitoring systems in place for their data pipelines and applications. The key is extending this foundation to cover the unique challenges that AI powered applications present.
The biggest mistake is trying to monitor every aspect of system behavior at once.
1. Assess your current data and AI infrastructure
Catalog every AI application in production, from customer-facing chatbots to internal analytics tools. Document how data flows through each one, which platforms and external services it touches, and who owns it. This step routinely surfaces surprising connections, like applications quietly sharing a data source or a piece of infrastructure that nobody had mapped.
2. Choose the right AI observability tools
General-purpose monitoring tools aren't built for AI-specific failure modes. Look for platforms with automated performance tracking, drift detection, and bias monitoring that work without extensive custom configuration, rather than tools that require a team to hand-build every dashboard from scratch.
3. Build monitoring dashboards for every audience
The same observability data needs to serve data scientists who want granular performance metrics, operations teams who need infrastructure health indicators, and business stakeholders who want a high-level read on AI application performance. Design for all three from the start rather than retrofitting summaries later.
4. Train teams and establish response protocols
AI incidents don't all look alike, and they don't all need the same responders. Define who owns data-quality issues versus model-performance problems, make sure everyone knows who to contact for each scenario, and set clear escalation paths for when the first response doesn't resolve it.
Done well, this pays off quickly: Forrester's analysis found a 357% ROI on AI observability implementations over three years, with payback in under six months, and JetBlue's 16-point NPS gain came within a year of adopting observability practices across its operations.
Looking for essential insights to UCaaS monitoring?
AI Observability Best Practices
Beyond the implementation steps above, a few habits separate AI observability programs that stay useful from ones that quietly stop being trusted after the first false alarm or missed incident.
-
Start with the highest-risk applications first. Trying to instrument every system on day one is the most common reason AI observability rollouts stall, so narrow the scope to the AI tools that touch customers or revenue directly.
-
Instrument at the trace level, not just the call level. A single prompt-response log misses the retrieval steps, tool calls, and reasoning chain that actually explain a failure.
-
Automate drift detection rather than relying on periodic manual review. Model quality can degrade gradually enough that nobody notices until a quarterly check-in. Automated alerts close that window.
-
Tie evaluations to real production traffic. Evaluation datasets built only from synthetic test cases miss the edge cases production users actually generate.
-
Unify LLM and infrastructure metrics wherever possible. Token costs, model latency, and GPU utilization are easier to diagnose together than in separate tools.
-
Loop in compliance and ethics stakeholders early, not after an incident. Fairness and bias monitoring is far cheaper to build in than to retrofit.
-
Document escalation paths before you need them. The middle of an incident is the wrong time to decide who owns a data-quality issue versus a model-performance one.
-
Revisit thresholds as usage grows and treat alert tuning as ongoing maintenance, not a one-time setup step. An alert tuned for a pilot with a few hundred requests a day will either go silent or fire constantly once the same application handles production volume.
How IR Can Help
Choosing and evaluating AI observability tools is only half the challenge. The other half is making sure AI observability doesn't become one more disconnected dashboard alongside the ones a team already has for infrastructure, communications, and payments.
That's the problem Iris, IR's natural-language AI layer built on the Prognosis platform, is designed to solve. AI performance monitored in the same place as the unified communications, contact center, and payments infrastructure it depends on, rather than bolted on separately.
IR Collaborate helps integrate observability and optimize performance across existing IT infrastructure, bringing monitoring and observability together to improve data quality, reduce downtime, and increase system performance. More than 1,000 organizations in over 60 countries, including some of the world's largest banks, airlines, and telecommunications companies rely on IR's solutions to:
-
Identify issues faster, before they reach customers
-
Find and fix the root cause of problems quickly, so teams aren't chasing symptoms
-
Maximize performance across the system while minimizing user impact
Explore Iris on the Prognosis platform >>
See IR Collaborate for unified communications >>
Watch our products and solutions in action >>
What Our Customers Say
“IR shows me what’s currently going on, as well as what has been going on, at different times of the day or week. Because we have this historical data, we get deeper insight into performance, which means we can get better at spotting anomalies and keeping on top of things.”
- Si Thu, Senior Manager for Payment Operations, Woolworths Group
"Prognosis is a world-class tool and we have become a world class company because of prognosis. What it provides is a holistic view of your call management system. And the support. Everyone at IR has a common goal – to make sure that prognosis is doing exactly what it’s supposed to do."
- Jon Beaver, Managed Services Platform Engineer at Presidio
“Recently we integrated IR Transact, powered by Prognosis to monitor the entire transactional flow of ATMs and POS, which allows us to ensure the continuity and availability of services. Our clients appreciate that by having world class monitoring tools like IR Transact, we can strengthen regulatory and compliance requirements, and ensure that we fulfill all our obligations to our clients.”
- Claudio Ávila Luna , head of Production Switch at Prosa
Ready to see AI observability in action?
See how Iris brings AI observability into your existing Prognosis environment, alongside the unified communications, contact center, and payments infrastructure you're already monitoring.

Frequently Asked Questions
Q: What is AI Observability?
AI observability is the process of continuously collecting and analyzing data, including logs, metrics, traces from AI systems to understand their internal state, performance, and behavior. Observability tools enable teams to diagnose AI performance issues in real time, ensuring reliability, and optimizing efficiency.
Q: What are AI observability tools?
AI observability tools are software platforms that continuously collect and analyze logs, metrics, and traces from AI and machine learning systems to reveal model behavior, performance, and reliability.
Through observability and evaluation, they help teams detect drift, bias, and degradation, and diagnose issues that traditional application monitoring can't surface. These tools span categories from open-source tracing libraries to enterprise-embedded observability platforms.
Q: How do I choose the right AI observability tool for my organization?
Start with framework and provider coverage, trace depth for any agents in production, and how well evaluation workflows fit your existing process. Then weigh deployment model, cost structure, and governance requirements against your industry's compliance needs. See How to Evaluate AI Observability Tools above for the full breakdown.
Q: What's the difference between AI observability and LLM observability?
LLM observability is a specialized subset of AI observability focused specifically on large language models, tracing prompts, reasoning steps, tool calls, and output quality for LLM-powered applications and agents. AI observability is the broader category, covering every type of AI and machine learning system, not just LLM monitoring.
Q: What is black box AI?
With a black box AI system, users can see the system's inputs and outputs but can't see what happens within the AI tool to produce those outputs. Many of the most advanced ML models available today, including large language models, are black box AIs. That opacity can mask cybersecurity vulnerabilities, biases, privacy violations, and other problems, which is exactly what AI observability tools are built to surface.
Q: What are AI agents?
An AI agent is a system that autonomously performs tasks by designing workflows through thought processes, goals, memory context, intermediate reasoning, and tool usage. Agent observability tracks that full execution tree, not just a single input and output.
Q: How does AI observability differ from Application Performance Monitoring (APM) tools?
APM tools monitor known performance metrics (like response times and error rates) for simpler applications, providing visibility into application health and user experience. AI observability addresses the "unknowns" in dynamic, distributed AI environments by correlating logs, metrics, traces, and model performance data
Q: What skills does my team need for AI observability?
Teams typically need advanced programming and data science skills, cloud infrastructure experience, strong analytical and problem-solving ability, cross-team collaboration and communication skills, and working knowledge of AI ethics and bias. Fewer organizations build all of this in-house from scratch; most combine internal expertise with a platform that handles the instrumentation and evaluation tooling, so the team's time goes toward interpreting results and fixing root causes rather than building pipelines.
Q: How long does AI observability implementation take?
It depends on organizational readiness, infrastructure complexity, the specific implementation approach (custom vs. platform), and the chosen tools. It can take anywhere from days or weeks for basic platform-based solutions, to several months for complex, enterprise-wide rollouts.
Q: What is Retrieval-Augmented Generation (RAG)
An AI framework that enhances LLMs by combining them with external knowledge sources, like documents or databases, as a result of a query. Instead of relying solely on their static, pre-trained data, RAG systems retrieve relevant information from these external sources and attach this information as context to the LLM framework.