

















Somewhere, in your organization’s contact center, a call isn’t going well. There are countless problems that can affect your agents, your customers and your ROI.
Audio lag and jitter, unstable VoIP connections that could be causing dropped calls, screen-pop failures, CRM freezing or crashing, SSO lockouts, misdirected IVR routing. These common issues and many more, can cause customer frustration, agent anxiety and eventually, a ticket for someone in IT to deal with.
Dealing with these issues manually, has a massive, measurable impact on your organization’s profit and loss statement.
What the diagnosis gap costs in time
Most incident-response metrics focus on resolution time, or how long it takes to fix a problem once it’s understood. But for a most contact-center and UC issues, the real cost is arriving at the point where you know what to fix.
Without a single, real time view that spans networks, platforms and devices, diagnosis usually means manually checking systems that don’t talk to each other. Often, a network monitoring tool, a platform status dashboard and device telemetry are not built to answer questions together, so it falls to IT admin to cross-reference and rule out causes one tool at a time.
According to HappySignals' Global IT Experience Benchmark for 2026, an average of three hours and eighteen minutes of productivity is lost per IT incident, and this climbs to ten and a half hours for more complex incidents. A meaningful chunk of this is time spent simply trying to diagnose what the problem is, and whose desk it belongs to.
What the diagnosis gap costs in dollars
While time is one way to measure this cost, in terms of money, the diagnosis gap is an expensive place for a contact center to be.
Starting with the baseline, Gartners customer service benchmarks puts the median cost of a human-assisted contact at $13.50. This is the cost of an ordinary interaction handled once, and resolved. But an undiagnosed technical issue can escalate. When a frontline agent can’t quickly establish whether a problem is local, in transit, or platform-side, the question becomes ‘is it me, or the platform?’
Forrester’s 2025 Customer Experience research (as reported by Stealth Agents) found that an escalated contact costs, on average, 2.3 to 3.5 times as much as a standard contact in the same channel. This translates to a cost of $30–$47 accounting for the extra time, the extra people, and the additional tooling involved in resolving the issue.
Secondly, if the underlying cause was never actually identified, the same problem often comes back.
MetricNet's 2024 Contact Center Benchmarking Report, drawn from more than 120 enterprise contact centres across North America and Europe, found a median same-issue repeat contact rate of 23% within a seven-day window. In other words, nearly a quarter of contacts involving an unresolved issue generate a second contact about the exact same problem, which means the diagnosis cost is paid again, sometimes with a second escalation attached.
If you consider these multipliers, a contact centre fielding a modest, steady stream of technical-friction complaints like dropped calls, degraded audio, or platform confusion, is absorbing a compounded mix of escalations running two to three times that initial average cost. This is on top of the multi-hour diagnostic cost that HappySignals already puts a number on.
|
Your platform dashboard says everything’s green. Your customer just heard the call drop. Our new guide shows why remote and hybrid teams have a visibility gap, what it costs, and how closing it protects customer experience. |
Applying the maths to your own organization
The exact figure for your own organization depends on your specific contact volume, and how much of it touches technical friction, rather than a straightforward query.
But illustratively, a contact centre fielding 2,000 technical-friction-related contacts a month at the $13.50 median cost per contact, is already at $27,000.
If you apply MetricNet's 23% repeat-contact rate, and roughly 460 of those contacts come back for a second round, it becomes another $6,200-plus, for problems that were not solved the first time.
Layer in Forrester's escalation multiplier on even a fraction of that volume, say the 30–40% that couldn't be resolved at the first point of contact, then the escalated share alone can run two to three times its original cost.
Added together, a contact centre in that range can be looking at tens of thousands of dollars a month for contacts that took longer, cost more, and often came back, because nobody could answer the question "is it me, or the platform?" quickly enough the first time. And this is before including the multi-hour productivity drag on the IT staff doing the manual cross-referencing in the first place.
Why it’s worse for distributed teams
If an agent is removed from IT, physically, or just organizationally, as is increasingly the case with remote, hybrid, and outsourced capacity, the diagnostic chain becomes longer. It becomes more likely that a problem will escalate or repeat before it’s resolved.
An issue that might take minutes to triage on a monitored, on-site machine can take hours when the first step is simply establishing whether the fault is local, in transit, or on the platform side.
Distance from IT doesn't just slow the fix. It slows the very first step of figuring out what's broken, which is precisely what determines whether a contact costs $13.50 or three times that.
How to shorten the diagnostic chain
The fix is not about speeding up your manual diagnostics with a faster ticketing system or a better on-call rotation. It's about removing the need for manual cross-referencing in the first place.
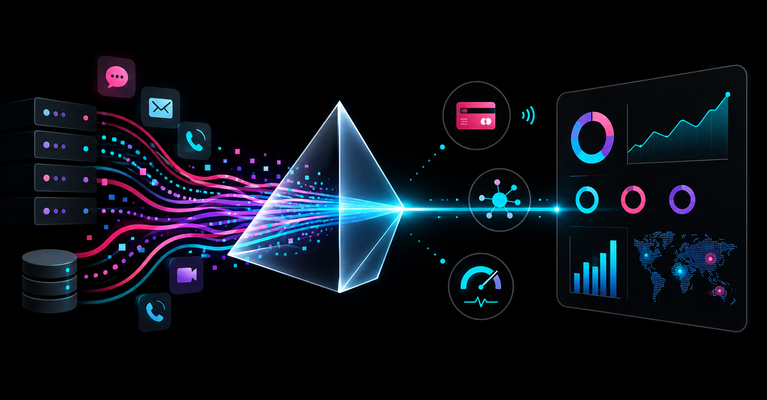
The solution is to give IT one place to see network health, platform reachability, and device performance together, for any IT team member and agent, in real time.
With this view, the question "is it me, or the platform?" stops being a multi-tool investigation and becomes a five-second glance. Fewer issues need to escalate because the cause is visible immediately, and fewer issues will escalate because the root cause gets fixed the first time.
This is the difference between a $13.50 contact and a $40 one, multiplied across everything your distributed workforce handles in a month.
Clarion – powered by Iris
This is exactly what Integrated Research has built into Clarion, the new intelligence layer that makes every worker visible, supported, and able to do their best work.
Clarion is our newest, most innovative offering. A lightweight, endpoint-level intelligence layer designed to sit alongside existing monitoring platforms, so that you can capture and observe the metrics that matter.
Individual workers and IT teams get shared, real-time answers to the questions that currently have none.
With a fleet-wide dashboard you can aggregate telemetry from every endpoint into one cloud-based view, give everyone real-time visibility across a distributed workforce.
Clarion has been built to answer the question, ‘is it me or the platform?’
In the world of global enterprise, IT complexity is not just a challenge, it’s a material risk. For over thirty-five years, IR has been the invisible support behind the world’s most critical operations, turning insights into a performance advantage.
Clarion was built to close the visibility gap, so that your team is always visible, constantly supported and able to do their best work. Your customers benefit from faster resolution and increased satisfaction, which means significant cost savings for your organization.