


.png?width=141&height=141&name=Transact%20(1).png)






.svg)

.svg)
.svg)
.svg)


%201.svg)












Blind Spots in Your Workforce?
58%
of service organizations outsource at least some agent capacity.
Platform monitoring stops at the platform - for offshore agents, the blind spot is total.
of service organizations outsource at least some agent capacity.
Platform monitoring stops at the platform - for offshore agents, the blind spot is total.

average productive time lost per employee, per IT incident.
And as much as 10 hours 35 minutes for complex troubleshooting cases.

the approximate cost to the average enterprise per year.
Due to downtime and productivity losses. And the people impacted most are your customers.
Clarion pairs an on-device widget with a centralized cloud dashboard, so agents, UC users, and IT admins each see exactly what they need - the moment it matters.
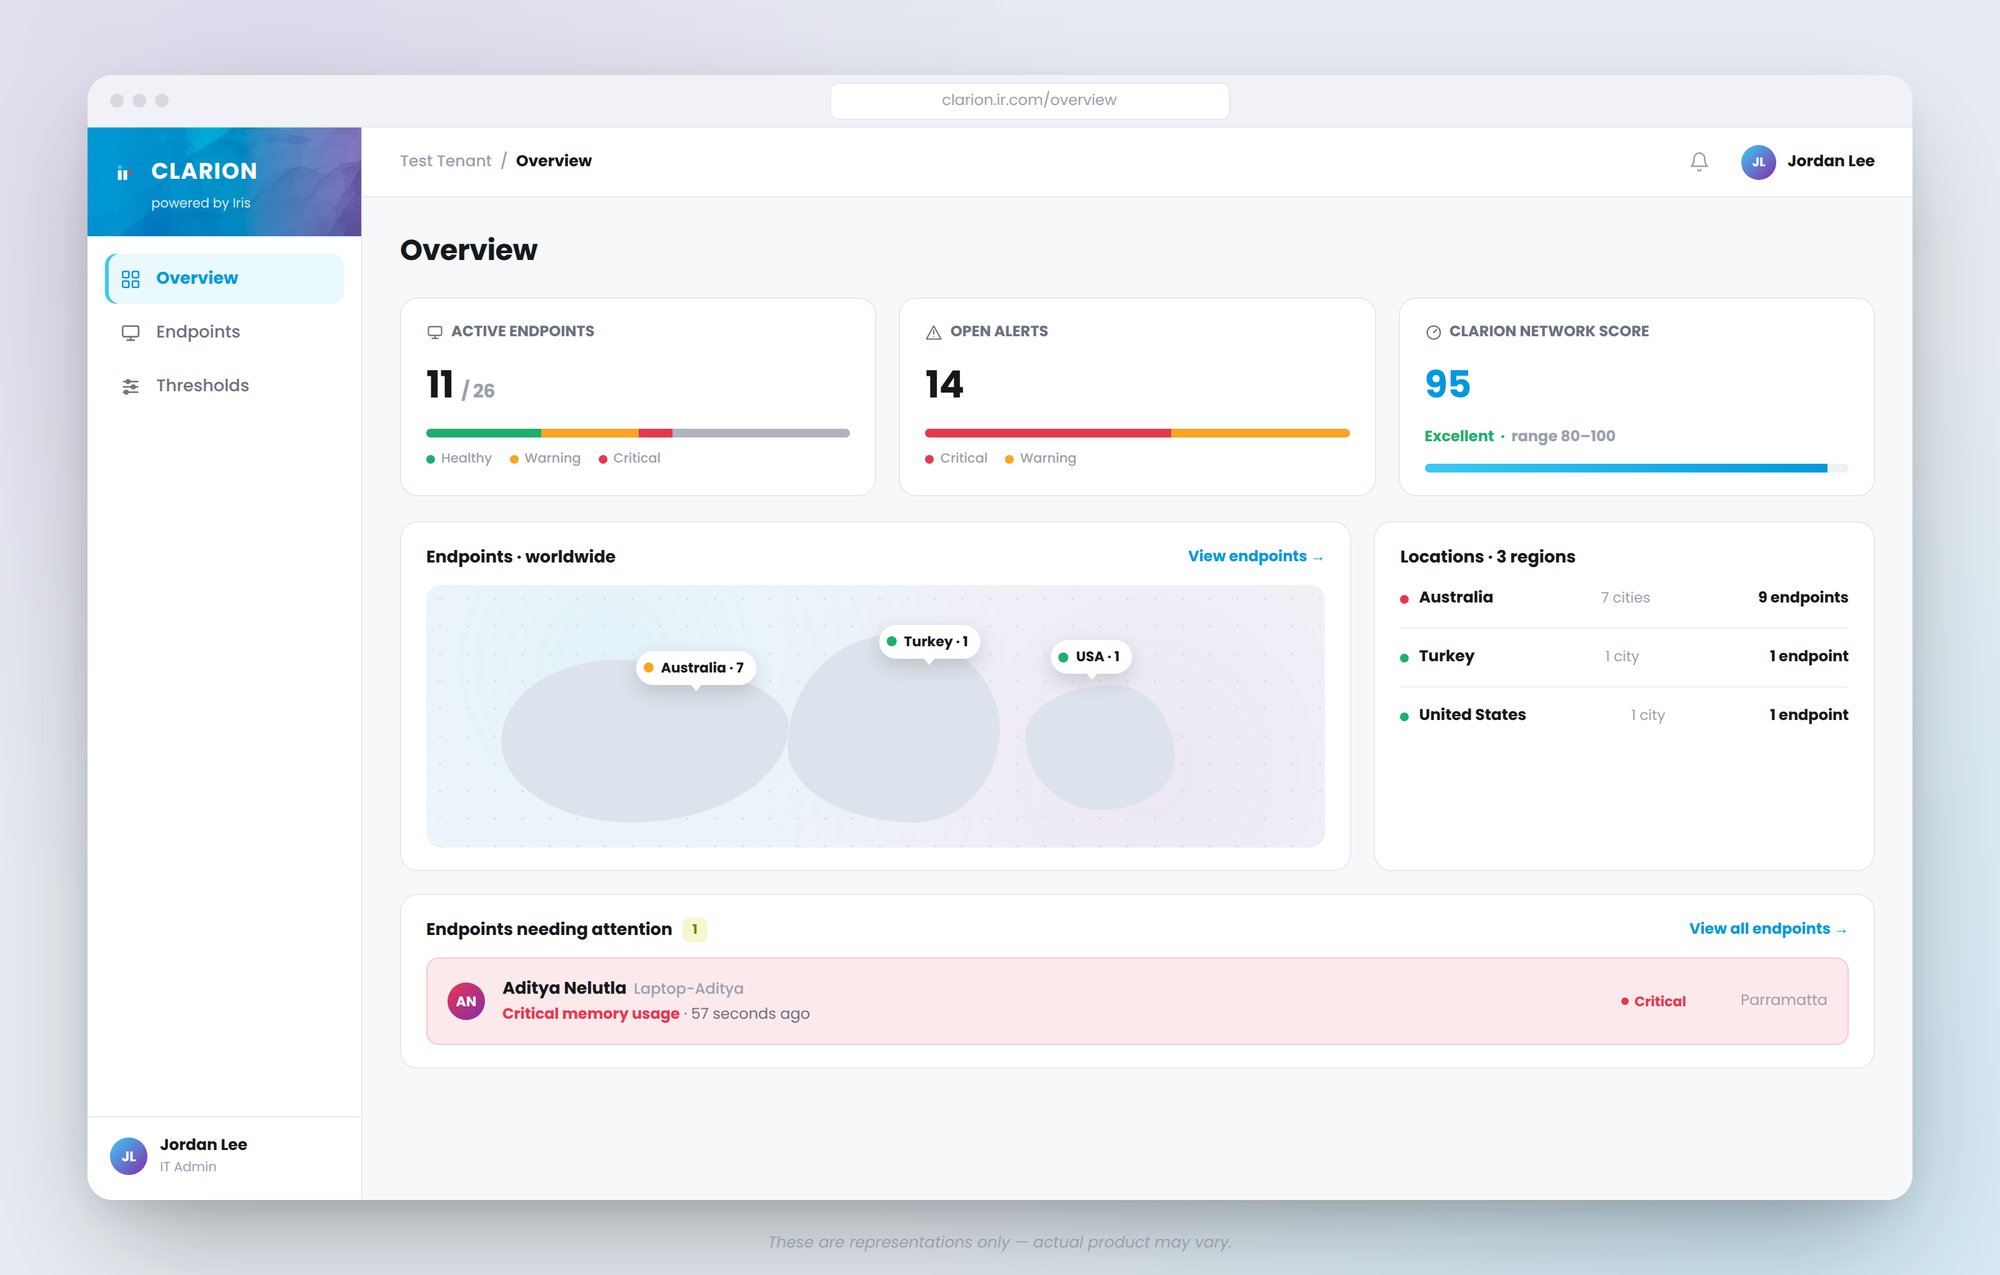
Telemetry from every endpoint rolls up into a centralized, cloud-based view — giving IT admins real-time visibility across the entire distributed workforce, with guided issue reporting that streamlines ticketing and troubleshooting.
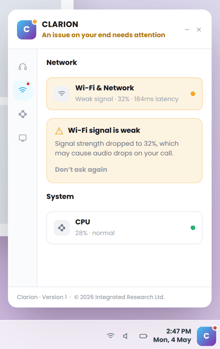
A lightweight widget continuously observes network health, platform connectivity, and endpoint performance — surfacing insights to the worker the moment they matter, and answering "is it me, or the platform?" before the next call starts.
COMING SOON
End-user data feeds directly into Prognosis, unlocking deeper analysis and letting workers ask Iris AI questions about their own setup, extending Clarion's visibility across the wider Prognosis platform.


Purpose-built for the modern contact center and UC workforce — granular intelligence at every layer, from network to endpoint.

Latency, packet loss, jitter, Wi-Fi signal, and VPN status - pinpoint whether an issue is local, ISP, or platform-side.
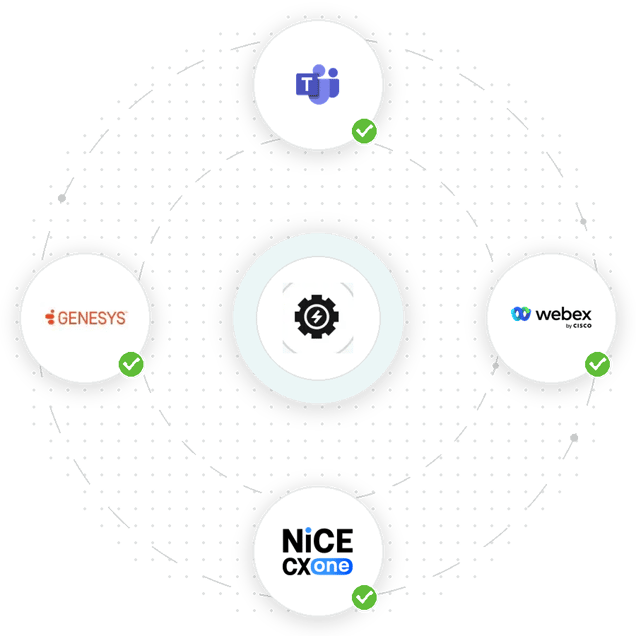
Live status for Teams, Zoom, Webex, Genesys, and NiCE CXone - know the instant a platform goes unreachable, not after the ticket comes in.
CPU, memory, disk, audio/video devices, and drivers - catch failing hardware before it fails on a customer call.
Captures a snapshot and logs the moment something breaks, then drafts the IT email for you - one click to send.
One view for IT admins across the entire distributed workforce.
Clarion is a lightweight monitoring solution built for the modern contact center and UC workforce. A small widget runs quietly on every worker's Windows machine, continuously tracking the conditions that affect call quality — network health, platform connectivity, and endpoint performance — and surfaces insights in the moment, answering the question that matters most: “is it me, or the platform?” That telemetry rolls up into a centralized, cloud-based Fleet Dashboard so IT has real-time visibility across the entire workforce.
Clarion gives you real-time visibility into every worker's calls, meetings, and endpoint health, so issues get caught and resolved faster. Everyone works better: Users get their own answer to "is it me, or the platform?" and can fix simple issues themselves. IT spends less time firefighting: Fewer tickets and fewer hours lost to guesswork. Faster, more accurate fixes: A real-time, shared view of performance issues points IT straight to the right response.
Clarion has three components: the Widget that runs on each end-user's machine, the Fleet dashboard that IT works from, and the Iris platform where the Clarion subscription is set up and administered.
Three categories, all tied to connection and device health: network & connectivity (latency, jitter, packet loss, Wi-Fi signal, VPN status), platform reachability, and device/endpoint health (CPU, memory, disk, drivers, app versions). Nothing beyond that.
MS Teams, Zoom, Webex Multi-Tenant, Genesys, and NiCE CXone.
Each customer gets a dedicated tenancy with its own database schema — your data is never comingled with another customer’s. It’s encrypted both in transit and at rest. Regional hosting is still being finalized outside the U.S., so ask your account team to confirm current data-residency options for your environment before you rely on a specific region.
No. Clarion deploys as a lightweight, signed installer through your existing device management tooling (e.g., Intune) and runs on Windows 10/11. It connects outbound only, so no inbound firewall changes are typically required. There’s no on-prem footprint to manage.
It’s deleted according to the terms of your agreement once the subscription ends.
No. Clarion is designed to run quietly in the background with minimal performance impact, and it starts automatically with no setup required from the end user. It does not record screens, cameras, or call audio, and it does not log keystrokes or track user activity — it monitors the health of the connection and device, not the content of the call or the person using it.
Yes. Clarion is deployed in one of two modes. The mode is set as configuration at install time and cannot be changed by the end-user. It is chosen at contract stage. 1.Interactive mode gives the end-user a small always-on widget with a status indicator and alerts them when something degrades, so they can act on it themselves or report IT issues. This reduces the time each individual loses. 2.Telemetry-only mode runs the widget headless as a background process. Nothing appears on screen, no window is created and focus is never taken. Everything IT-facing works identically.
Admins can configure alert thresholds — that's what drives severity behavior. End-user messages and dashboard messages are not configurable; they display automatically based on the thresholds the admin has set.

Guides, webinars, and product resources to help you understand
capabilities, use cases, and best practices.