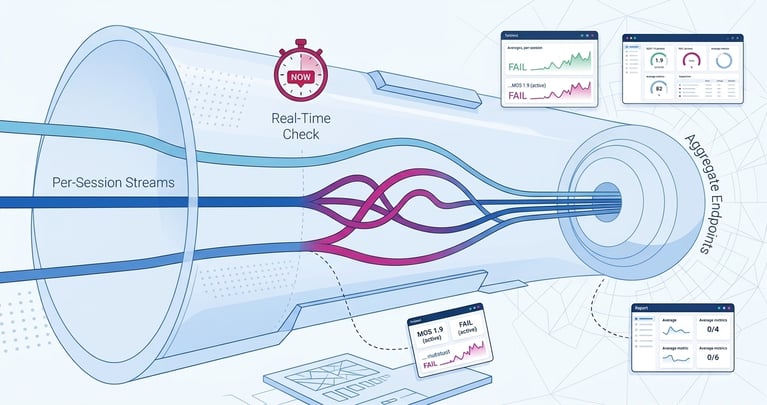
















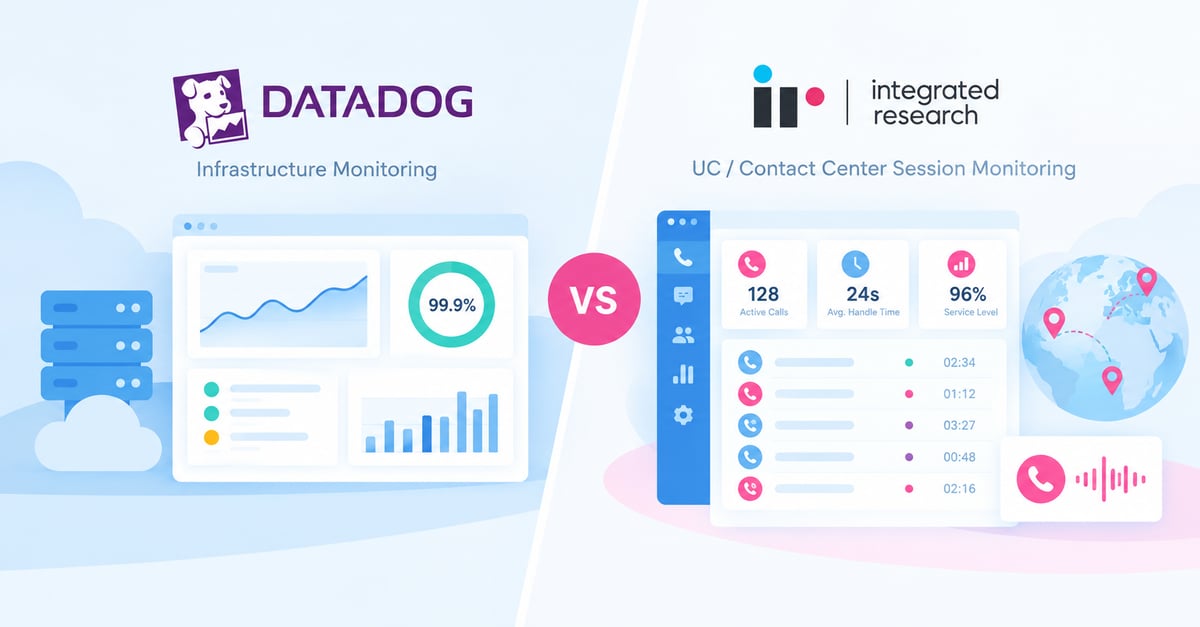
Datadog can show every server, container, and API endpoint running green while a contact center agent is still fighting a call that keeps cutting out.
That gap is not a bug in Datadog. It is a boundary. No infrastructure and application monitoring platform, however wide its integration catalog, was built to see inside a voice call, a Teams meeting, or a multi-vendor contact center queue. "Full-stack observability," as most vendors sell it, usually means full-stack infrastructure. It rarely means full-stack experience.
Key takeaways: enterprise observability requirements
- Infrastructure observability and session-level UC observability solve related but different operational problems.
- Datadog gives engineering teams broad infrastructure and application coverage across modern cloud estates.
- IR Collaborate gives teams domain-specific visibility into calls, meetings, queues, and multi-vendor UC environments.
- Enterprises often need both layers because customer experience can fail even when infrastructure dashboards stay green.
- True enterprise observability depends on depth in the business-critical layer, not just breadth across infrastructure tools.
Two different observability problems wearing the same name
"Full-stack" usually describes infrastructure coverage, not experience coverage.
Datadog's stack spans hosts, containers, databases, and application code, correlated through metrics, logs, and traces. That is a genuinely useful full stack for engineering teams debugging a microservice. It says nothing about whether a call between a customer and an agent, or two employees on a Teams meeting, actually completed at acceptable quality.
Enterprises that treat these as the same problem end up with a monitoring stack that is wide but shallow exactly where it counts most: the moment someone actually experiences the system. That can mean a bank's contact center during a high-volume period, a multi-site retailer's Teams estate, or a healthcare provider's clinical communications.
What Datadog is built to do
Broad infrastructure and application coverage, not session-level UC telemetry.
Datadog is one of the most widely deployed platforms for cloud-native infrastructure and application monitoring, unifying metrics, logs, and traces across hosts, containers, and services, with a large integration catalog covering common cloud and DevOps tooling. For engineering teams standardizing on one view of infrastructure health, that breadth is the appeal.
For a wider view of how general-purpose platforms compare at the infrastructure layer, see IR's enterprise observability tools comparison. What Datadog is not built to do is trace a degraded Teams call from endpoint through SBC and carrier, or correlate a slow IVR queue with the health of the contact center platform behind it. That is not a shortcoming. It is simply outside the category Datadog competes in.
What enterprise observability actually requires
Beyond infrastructure uptime, you need session, vendor, and business context.
Real enterprise observability has to answer more than "is the infrastructure up." Gartner's 2026 Market Guide for Data Observability Tools describes strong adoption momentum for observability tooling among data and analytics leaders. The open question for most enterprises is not whether to invest. It is whether that investment reaches the layers where the business is actually exposed.
For UC, contact center, and customer-experience environments specifically, that means:
- Session-level visibility: tracing a specific call or meeting end to end, not just the servers behind it.
- Multi-vendor correlation: seeing Teams, Webex, Cisco, and Avaya environments in one view rather than one platform at a time.
- Deployment flexibility: covering cloud, on-premises, and hybrid UC estates without a gap at the boundary.
- Business-critical context: connecting a degraded session to the customer or employee experience it affected, not just an infrastructure alert.
Full-stack observability is not one platform seeing everything. It is having genuine depth in the layers that actually touch the customer.
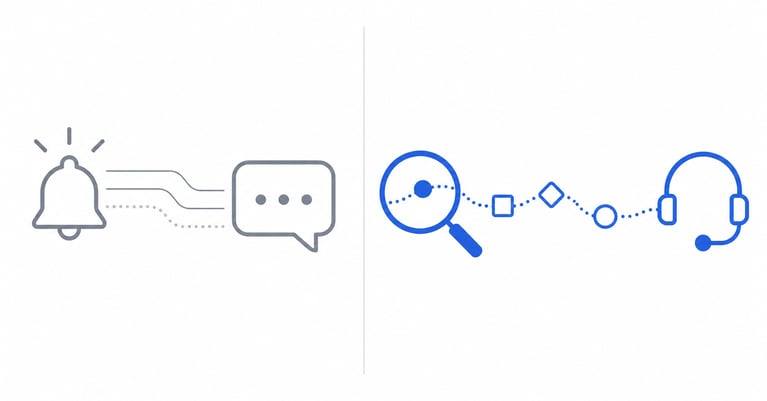
A general-purpose platform can route the right alert to the right channel. It cannot, on its own, tell you why a specific call sounded broken.
Datadog and IR Collaborate solve different layers of the same problem
Their coverage starts and stops in different places.
| Capability | Datadog | IR Collaborate |
|---|---|---|
| Infrastructure and application monitoring | Broad and deep | Not the primary focus |
| Session-level UC and CX telemetry | Not built for this | Purpose-built |
| Multi-vendor UC correlation | Not covered | Core capability |
| Deployment model | Cloud-based | Cloud, on-premises, or hybrid |
| Primary use case | Infrastructure and application observability | UC and contact center observability |
These platforms are not competing for the same job. Many enterprises run both: Datadog for infrastructure, and IR Collaborate for the UC and CX layer Datadog was never designed to see.
How IR Collaborate can help
Session-level visibility a general-purpose platform cannot provide.
IR Collaborate delivers observability across unified communications, collaboration, and contact center ecosystems, helping teams prevent issues before they affect performance and experience. It gives IT and network teams the session-level visibility a general-purpose platform does not provide.
- End-to-end session visibility: traces a call from endpoint through SBC and carrier to show exactly where quality degraded.
- Multi-platform coverage: extends visibility across Teams, Webex, and other UC platforms so a mixed environment is not managed one tool at a time.
- Deployment flexibility: supports cloud, on-premises, and hybrid environments without losing consistency at the boundary.
- Contact center depth: connects voice quality and availability issues to the customer experience they actually affect, not just an infrastructure metric.
For more on the domain depth this requires, read what enterprise observability means in practice or compare it with the live Teams-specific view in IR Collaborate vs Datadog for Microsoft Teams monitoring.
In conclusion: where full-stack observability stops
The question is not whether Datadog belongs in your stack. For infrastructure and application monitoring, it can.
The real question is whether full-stack stops at the infrastructure layer, or extends to where your customers and employees actually feel the difference. Enterprise observability that stops at the network is incomplete not because the tooling is bad, but because it was never asked to see any further.
Request a demo of IR Collaborate to see what is happening inside the calls and sessions your infrastructure monitoring cannot reach.
FAQs about Datadog and UC observability
See what your infrastructure tools cannot see
IR Collaborate helps your team connect session quality to the user and customer experience behind it.