






.png?width=141&height=141&name=Transact%20(1).png)






.svg)

.svg)
.svg)
.svg)


%201.svg)
















Most evaluations of real-time analytics platforms start with the wrong question. Teams shortlist vendors based on how quickly a dashboard refreshes, how many data points a chart displays per second, or how colorful the topology map looks. None of that tells you whether your team will catch a payment failure or a call-quality degradation before it costs you revenue.
IR builds its Prognosis platform around a different premise: real-time analytics should shrink the window between a system event and a human decision.
 If you are evaluating platforms for communications, payments, or infrastructure, that distinction separates a productive evaluation from months of misaligned vendor conversations. This article reframes how enterprise IT and operations leaders should evaluate real-time analytics and offers specific criteria you can apply to any shortlist.
Key Takeaways: Real-Time Analytics Evaluation
- Dashboard refresh speed is not a reliable proxy for actionable real-time insight in enterprise operations.
- Evaluation criteria should center on decision-window latency: the gap between event detection and informed action.
- Cross-system correlation is essential when your operational environment spans multiple vendors, service domains, and geographies.
- IR Prognosis provides cross-domain visibility that connects communications, payments, and infrastructure data in real time.
- Noise reduction and contextual alerting matter more than raw data volume when operating at enterprise scale.
Why "Real-Time Analytics" Is Often Evaluated the Wrong Way
Why Dashboard Speed Does Not Tell the Full Story
A dashboard that updates every five seconds looks impressive in a vendor demo. But speed of display is not the same as speed of insight. If alerts are generated without cross-system context, your team still needs to investigate, correlate, and diagnose manually.
That manual cycle adds minutes or hours to incident resolution. In a contact center handling thousands of calls per day or a payments estate processing high-value transactions, those minutes translate directly into revenue risk and degraded customer experience.
What Evaluation Teams Should Measure Instead
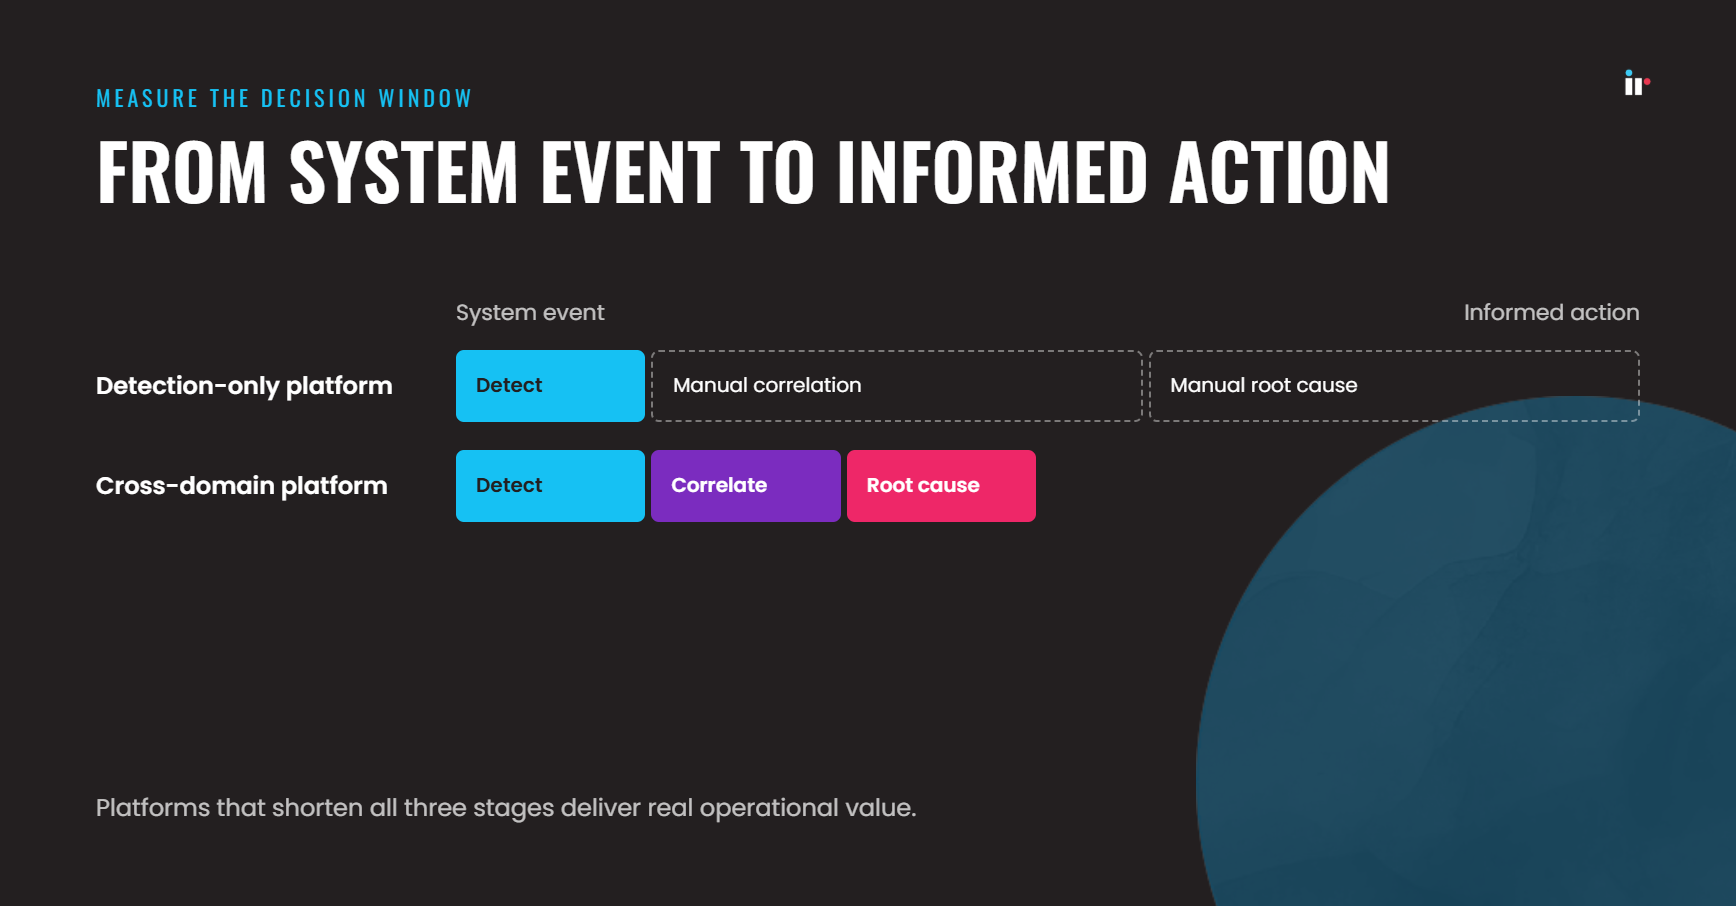
Focus on the decision window. How long does it take from the moment a performance anomaly occurs to the moment your operations team has enough context to act? That window includes detection time, correlation time, and the time it takes to identify the root cause of issues.
Platforms that shorten all three stages deliver real operational value. Platforms that only shorten the first stage, detection, leave the hardest work to your engineers.
What Real-Time Analytics Should Mean in Enterprise Operations
How Actionable Latency Changes the Evaluation
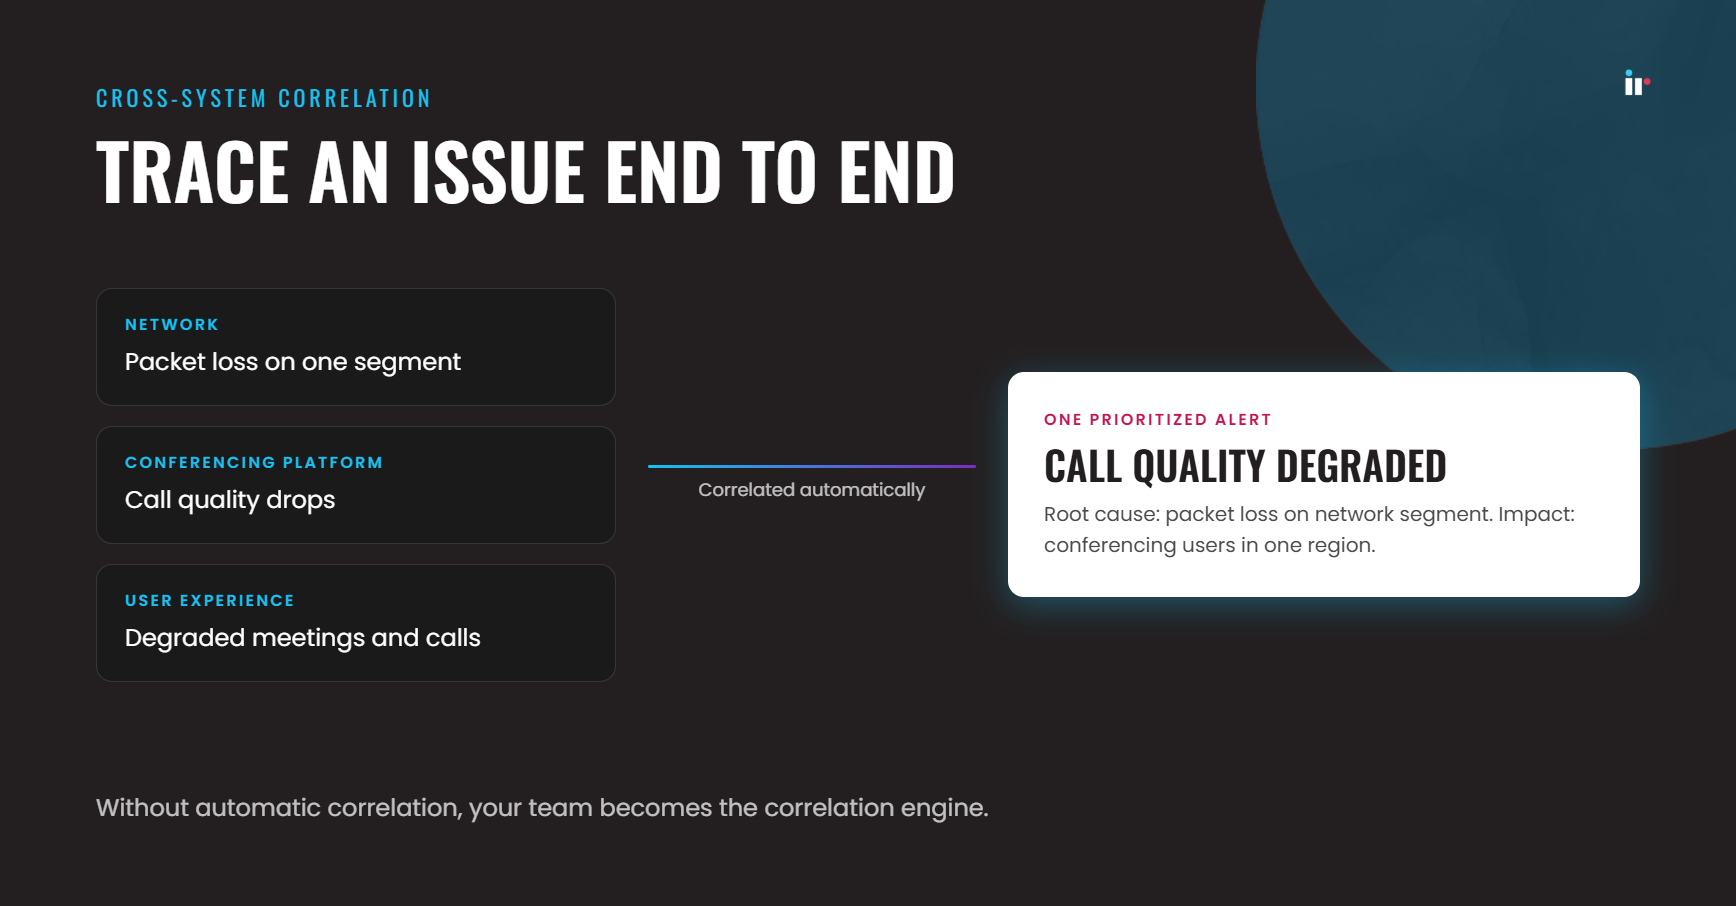
Actionable latency measures the time from a system event to a contextualized, prioritized alert that tells your team exactly what is degraded and where. In a multi-vendor UC&C environment, this means correlating packet loss on one network segment with call quality drops on a specific conferencing platform.
If your analytics platform cannot make that connection automatically, your team becomes the correlation engine. That is expensive, slow, and it does not scale.
Why Context Matters More Than Data Volume
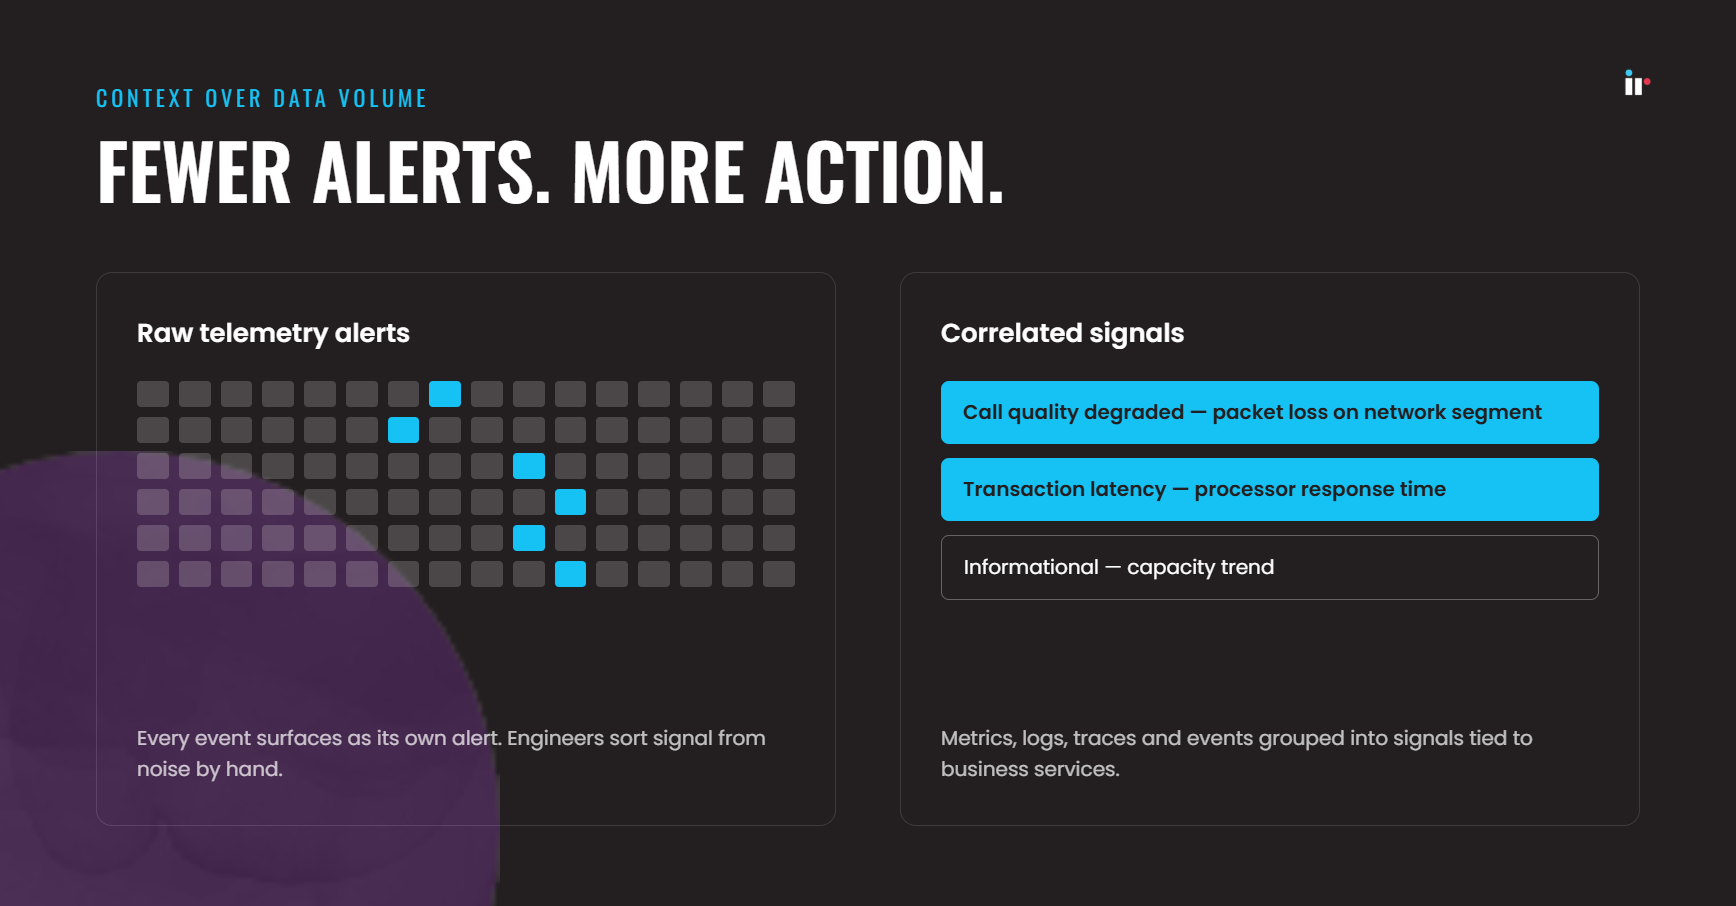
More data does not equal better decisions. A platform that ingests millions of events per second but presents them as undifferentiated alerts creates fatigue, not clarity. Enterprise operations teams need correlated signals tied to business services, not raw telemetry dumps.
The right platform should reduce the number of alerts your team sees while increasing the percentage of alerts that require action. IR approaches this by correlating metrics, logs, traces, and events into unified signals that explain why a KPI dropped, not just that it dropped.
What to Ask Vendors Before You Shortlist a Platform
Can the Platform Correlate Across Systems?
Enterprise environments run on multiple vendors. Your UC&C stack might include Cisco, Microsoft, and Avaya. Your payments estate might span on-premises switches and cloud-based processing. If your analytics platform treats each vendor as an isolated data source, you lose the ability to trace an issue end to end.
Ask vendors to demonstrate cross-domain correlation using your actual environment topology. A platform that cannot connect a network degradation to a user experience impact in a live scenario will not do it in production.
Does the Platform Reduce Noise at Enterprise Scale?
At 500,000 endpoints or more, raw alerting volume becomes unmanageable. Ask how the platform handles alert suppression, deduplication, and intelligent grouping. Look for AI-assisted analysis that identifies root causes rather than symptoms.
IR Prognosis uses tuned AI to keep false positive rates low while accelerating root cause identification. That means your engineers spend their time on resolution, not investigation.
Is the Platform Built for Multi-Vendor Environments?
Industry analysts, including ISG's 2025 Streaming Analytics Buyer's Guide, emphasize multi-vendor data correlation as a critical evaluation criterion. Some platforms are designed around a single vendor's ecosystem and retrofit multi-vendor support as an add-on. Others are built vendor-neutral from the ground up. The difference becomes obvious when you try to correlate events across Cisco and Microsoft or trace a transaction across multiple payment processors.
Ask whether the platform provides a single view across all your vendors or requires separate integrations and manual stitching. A platform designed for multi-vendor complexity will provide end-to-end visibility without additional middleware.
How Delays Turn Into Customer and Revenue Risk
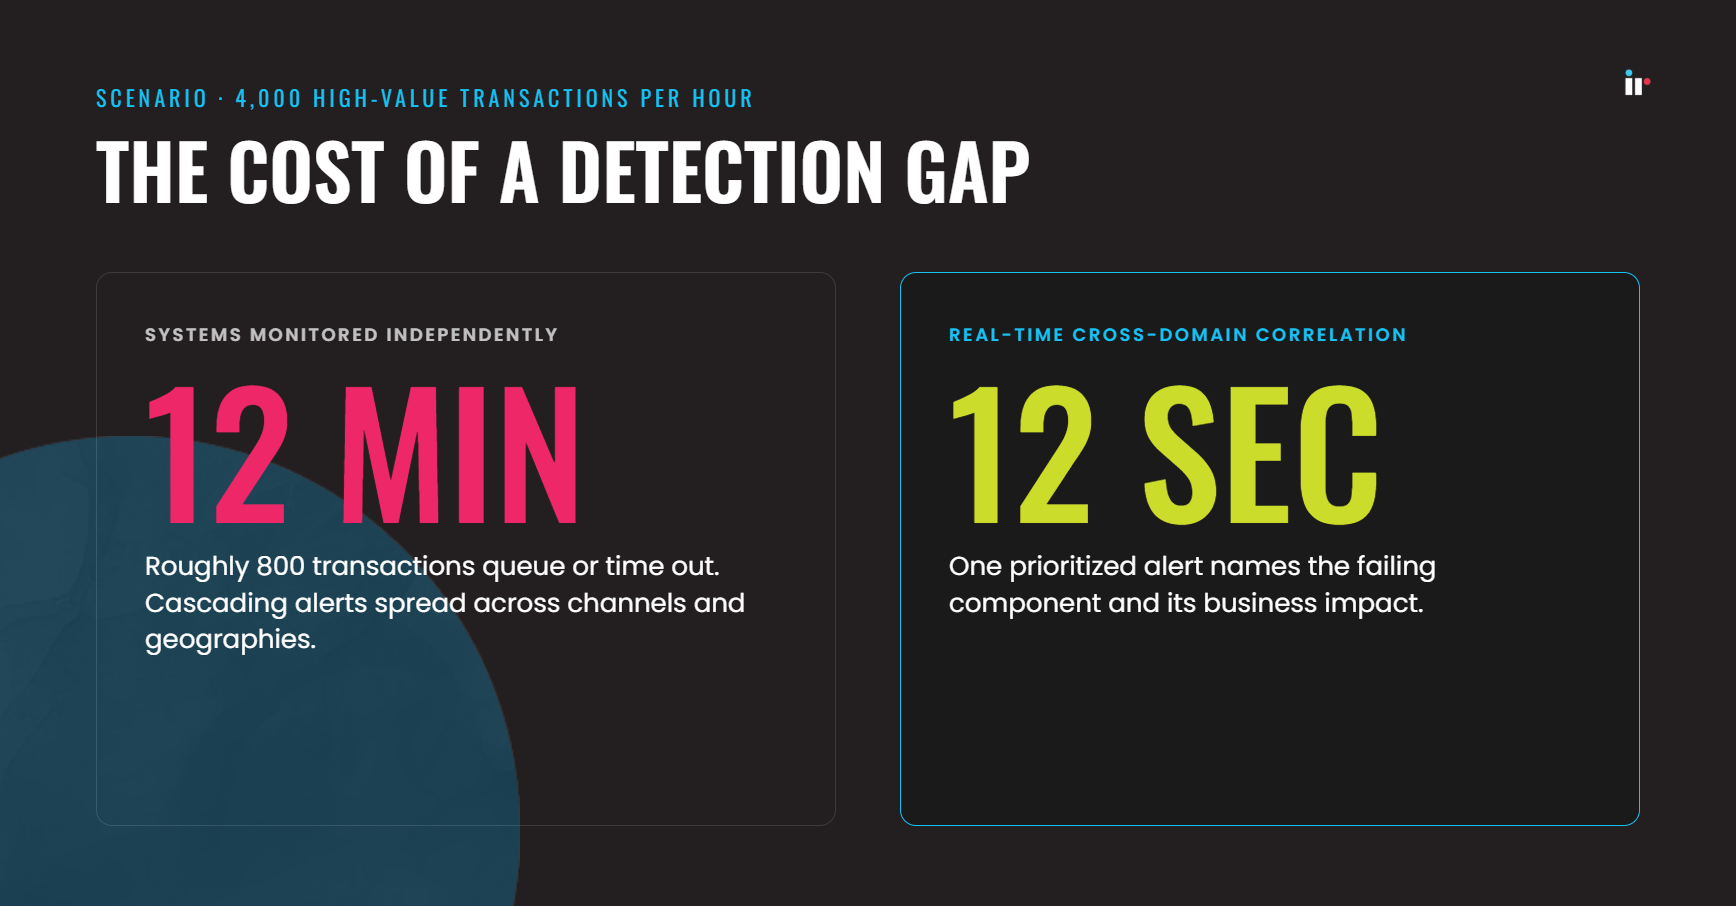
Let's say your organization processes 4,000 high-value transactions per hour through a multi-vendor payments estate. A latency spike on one processor goes undetected for twelve minutes because the analytics platform monitors each system independently.
In those twelve minutes, roughly 800 transactions queue or time out. Downstream systems fire their own cascading alerts. By the time the root cause of issues is identified, the impact has spread across channels and geographies. Multiply those 800 transactions by your average transaction value, and the operational cost of a twelve-minute detection gap becomes concrete.
Now consider the same scenario with a platform that correlates transaction latency with network performance and application health in real time. The anomaly is detected, contextualized, and escalated within seconds. Your operations team sees one prioritized alert that names the failing component and its business impact. Twelve minutes becomes twelve seconds. That is the difference evaluation criteria should measure.
How IR Prognosis Supports Real-Time Analytics Evaluation Goals
IR Prognosis is built for exactly the environments where real-time analytics evaluation matters most: multi-vendor communications, payments, and infrastructure. The platform correlates data across domains, connecting UC&C performance with contact center metrics, payment transaction health, and underlying infrastructure status.
Iris, IR's AI-powered assistant, lets your team query complex environments in plain language to surface insights without navigating multiple dashboards. This reduces the time from question to answer while keeping your team focused on outcomes rather than tooling.
With over 35 years focused on mission-critical environments, IR brings domain expertise built in the specific operational contexts where real-time analytics failures carry the highest consequences: contact centers, payments estates, and enterprise infrastructure.
FAQs About Real-Time Analytics for Enterprise Environments
Evaluate Real-Time Analytics With the Right Criteria
If you are shortlisting real-time analytics platforms, stop evaluating dashboard speed and start evaluating decision-window latency. Ask vendors to demonstrate cross-system correlation, noise reduction at scale, and native multi-vendor support.
The platforms that score highest on those criteria are the ones that will protect your revenue, your customers, and your operations team's capacity to focus on strategic work.
Request a demo of IR Prognosis to see cross-domain correlation in action across your communications, payments, and infrastructure environment.



.png?width=767&height=450&name=ivr-voice-testing-at-scale-tile%20(1).png)