






.png?width=141&height=141&name=Transact%20(1).png)






.svg)

.svg)
.svg)
.svg)


%201.svg)















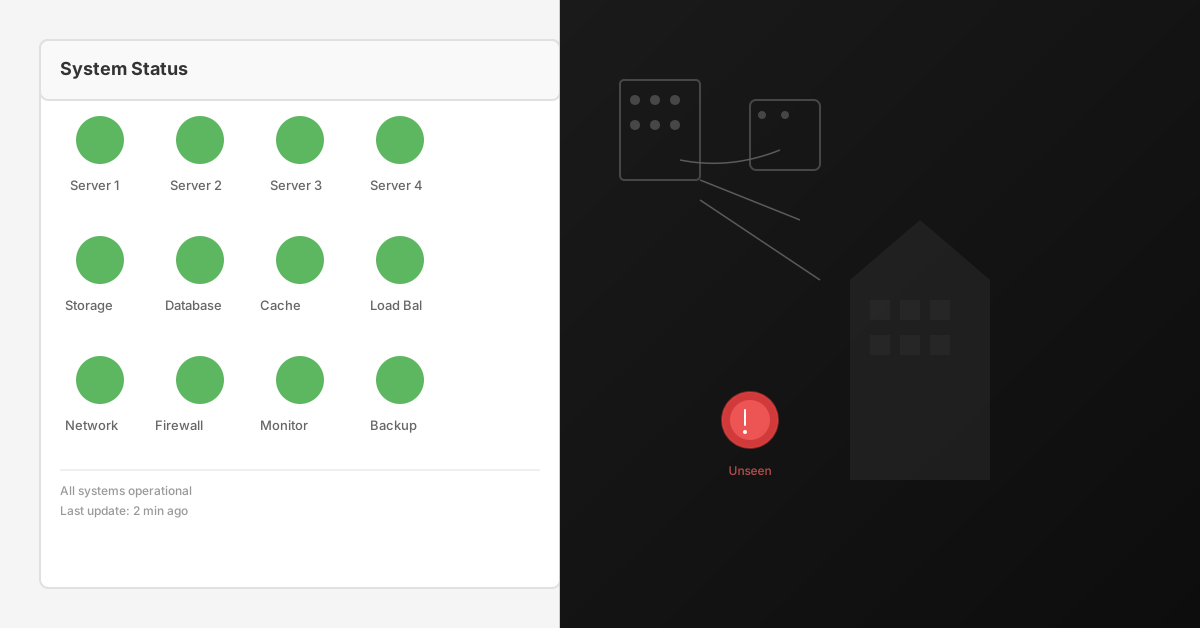
A user tells you last Tuesday's client call was unusable. You open Webex Control Hub, find the meeting, and every metric is green. The tool isn't wrong. It just can't see where the problem happened.
Native analytics report what the platform saw. End-to-end analytics report what the user experienced. On a healthy day they agree. On a bad day, the difference between them is the incident.
Where native analytics stop
The platform's view ends at the platform's edge
Control Hub describes Webex's own view of a session accurately. What it doesn't see is everything upstream of Webex:
- Network saturation
The corporate local area network (LAN) segment that hit capacity at 2pm. - Path configuration
The split-tunnel virtual private network (VPN) decision that added 40ms of jitter. - Endpoint hardware
The headset or laptop that was the real source of the distortion. - Carrier degradation
The internet service provider (ISP) path that degraded for your Manila office and nowhere else.
When the cause sits outside Webex, a Webex-only view reports the call as fine - because from where it stands, it was.
The table below contrasts what native platform analytics can answer against what end-to-end observability answers.
| Native platform analytics | End-to-end observability |
| Scope: the session inside the platform | Scope: endpoint, LAN, WAN, carrier and platform on one timeline |
| Did the platform perform as expected? | Where did the user's experience break down? |
| On a bad call: reports what it measured | On a bad call: shows the leg where quality dropped |
The questions native tooling can't answer
Four questions that decide how the ticket ends
- Was this a Webex issue, a network issue, or an endpoint issue?
- Did it affect one user, one site, or every user in the region?
- Is it happening right now, or has it cleared?
- Can you prove root cause before the user escalates to their account manager?
Answering these needs telemetry Webex doesn't own, correlated on a single timeline.
"A platform dashboard is a camera pointed at one room. It can tell you that room is calm. It can't tell you which corridor the trouble came down."
For the full framework on monitoring Webex across the environment it runs in, read IR's guide to Webex monitoring.
How IR Collaborate can help
The missing half of the picture
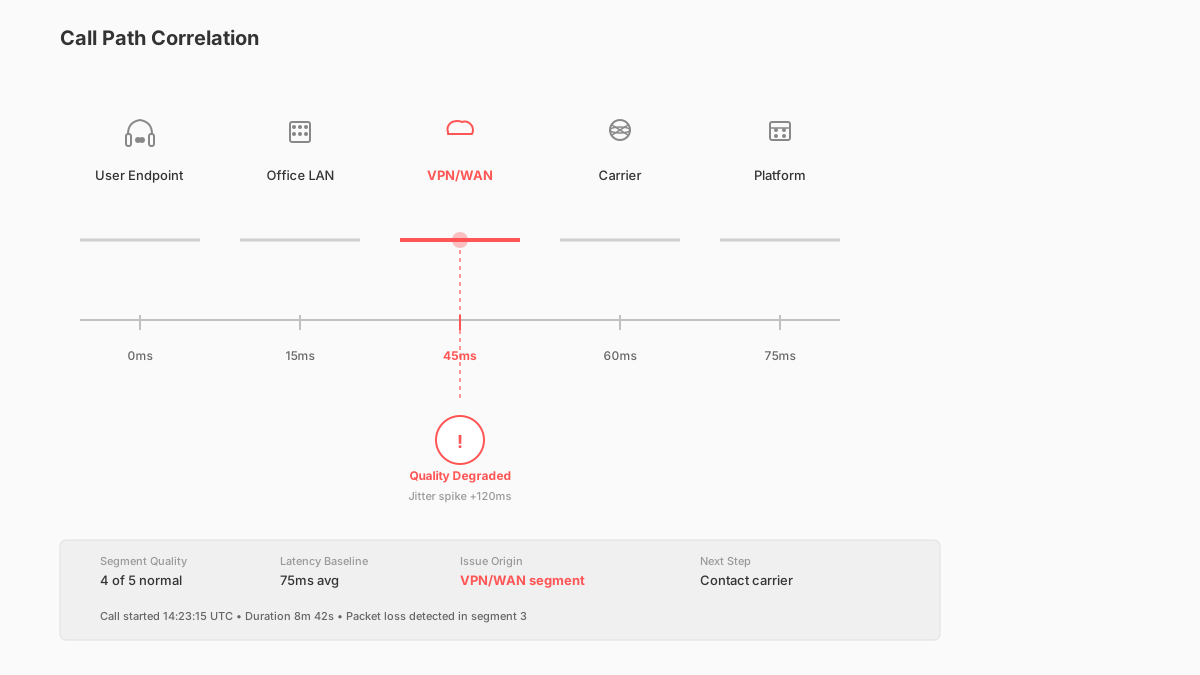
IR Collaborate, powered by Prognosis, sits across Webex and the environment it runs in - correlating call-quality data with network, endpoint and path telemetry on one timeline.
- One correlated timeline
Call-quality data sits alongside network, endpoint and path telemetry, so a degraded session can be traced end to end. - Scope in view
See whether an issue hit one user, one site or a whole region, before anyone asks. - Evidence, not opinion
When a user reports a bad call and the platform view says otherwise, you can name the leg where quality actually dropped.
The stakes, reframed
Trust is the real metric
Every "the call was fine" you can't back up erodes trust in IT - not in Webex. The teams that keep that trust aren't the ones with the greenest dashboards. They're the ones who can explain the red the dashboard never saw.
See what your dashboard can't
Get end-to-end visibility across Webex, the network and the endpoints your teams actually rely on.


.png?width=767&height=450&name=ivr-voice-testing-at-scale-tile%20(1).png)